Mutations
Relentless Drivers of Evolution and Disease
Doug Koshland, University of California Berkeley
 Doug Koshland
Douglas Koshland is a professor in the Department of Molecular and Cell Biology at UC Berkeley. His exploitation of microbial genetics to elucidate fundamental molecular mechanisms of cell biology led to his election to the National Academy of Sciences. During his career, he has participated in numerous programs that champion the democratization of science education
Summary
Life is not perfect. Mutations, rare and unavoidable changes to the sequence of DNA, alter gene function and, thereby give rise to new heritable traits. Mutations occur spontaneously in almost every cell of every living organism. They result from inherent errors during cell division as well as man-made and natural environmental insults. This uncontrolled tinkering with the genome may seem like a bad idea. Indeed, cancer and heritable human diseases are the products of spontaneous mutations. However, mutations are also the yarn from which Earth’s rich tapestry of diverse life arose and continues to evolve. In this Narrative, we will explore the origins, experimental design and conclusions of the great experiment of Luria and Delbrück. This three-day Nobel Prize winning experiment showed that new traits arise through the spontaneous and inevitable occurrence of mutations, settling a nearly century-old controversy on the origin of new traits. It also led to the birth of molecular biology as a discipline and pioneered the use of math to solve problems in biology. We will join modern scientists as they exploit quantitative thinking about mutations in the fight against the AIDS epidemic and cancer. By the end, hopefully you will view mutations as one of the fundamental flaws and wonders of living organisms, generating a wealth of unexplored biology waiting to be discovered.
Learning Overview
Big Concepts
Mutations, changes to the DNA code, provide the means of generating new traits that are subject to natural selection; they underlie the huge diversity of life on the planet and challenge us with overcoming drug resistance to cancer or viral and bacterial infections.
Bio-Dictionary Terms Used
Amino acids, bacterial cell division, DNA, DNA replication, gene, genome, mutation, messenger RNA, nucleotides, prokaryotes, ribosome, vaccine
Terms and Concepts Explained
Bacterial replication, viral replication, bacteriophage (phage), control experiment, drug resistance, human immunodeficiency virus (HIV), model organism, mutation, Poisson distribution, replica plating, retrovirus, reverse transcriptase
Introduction
-
Traits are passed down from parents to off-spring. But new traits occasionally can arise, leading to the diversity of life forms on Earth. These new traits result from spontaneous mutations.
Part I: Journey to Discovery – Spontaneous mutations underlie biological traits
-
Two competing theories were put forth of how new traits form - the Induced Mutation Model favored by Lamarck (a new environment induces mutations that create new traits) and the Spontaneous Mutation Model favored by Darwin (mutations are happening all of the time and creating new traits that are subject to natural selection). The controversy remained unresolved for nearly a century.
-
To solve the origin of new traits, Salvador Luria decided to study how bacteria become resistant to phage (a virus). His decision to use bacteria and phage as a model system was critical due to their large numbers and rapid growth. We will examine how scientists grow and study bacteria and phage. Some scientists at that time (1943) believed, as it turned out incorrectly, that the mechanism of bacterial inheritance was irrelevant to animals and plants. We will explore how bold and unconventional approaches are a hallmark of most seminal discoveries.
-
Luria thought that the appearance of new mutations would be a random event and could be described by a so-called Poisson process. We will learn how to use the Poisson distribution to predict the statistics of outcomes of independently occurring, rare, and random events.
-
Luria performed a Nobel Prize winning experiment that proved the traits arise through spontaneous mutations. We will follow the logic of this remarkable and influential experiment
-
A control experiment was needed to ensure that Luria’s results were real and did not arise by an artifact of his technique. We will examine the role of control experiments as a critical component of experimental science.
-
Max Delbrück teamed up with Luria to calculate the rate of spontaneous mutations. The role of math in solving biological problems is an important theme of this Narrative
-
Joshua Lederberg confirmed Luria’s conclusions using a completely different and clever technique called replica plating. Coming to the same conclusion with a different approach is a powerful way of validating an idea in science.
Part II: Knowledge Overview – The Physical Nature Of Mutations
-
There are five types of mutations that occur in DNA: single base changes, insertions, deletions, rearrangements (inversions and translocations), and duplications.
-
Mutations can alter a protein’s function by either changing its amino acid sequence or altering the level of its expression in the cell. However, most mutations in the genome are “silent,” leaving protein function unaffected. In addition, mutations can arise in non-coding, regulatory DNA which dictates when, where and to what degree proteins are produced.
-
Mutations arise from errors in DNA replication or insults from the environment that affect the chemical structure of DNA.
-
Three factors affect the appearance of a new trait 1) the spontaneous mutation rate (the number of mutations for a given base/round of replication), 2) the target size (the number of bases that can be mutated to produce the trait), and 3) the number of rounds of replication (the proliferation of the population).
Part III: Frontiers – The Role Of Mutations In Resistance To HIV (AIDS) And Cancer Drug Therapy
-
The human immunodeficiency virus (HIV) causes AIDS, a disease affecting 37 million people world-wide. The life cycle of the AIDS virus is presented.
-
A drug called AZT was developed that blocks a key replication enzyme of HIV. However, spontaneous mutations in HIV led to rapid drug resistance.
-
Using the general principles proposed by Luria and Delbrück, we will calculate the rate of appearance of drug-resistant HIV.
-
Again, using calculations, we see why the use of three drugs provides a much more effective treatment to stop HIV replication and treat AIDS.
-
Cancer cells also acquire many mutations and can become resistant to single drug therapy. The experiments of Luria and Delbrück prompted strategies of using multiple drugs in cancer chemotherapy. We will see why these strategies have been less successful because of the nature of the spontaneous mutations that cause resistance to chemotherapies.
Closing Thoughts
-
Bacteria are arguably the most evolved life forms on Earth because of their geological age and astronomical numbers which allow them to accrue more mutations and new traits.
-
While Darwin’s model of spontaneous mutations followed by natural selection is the most prevalent mechanism of evolution, an example of Lamarckian evolution has been uncovered recently in CRISPR-based immunity to phage infection.
Guided Papers
Luria, S. E., & Delbrück, M. (1943). Mutations of bacteria from virus sensitivity to virus resistance. Genetics, 28, 491–511
Luria and Delbrück demonstrate the existence of spontaneous mutations by following the distribution of phage-resistant bacteria in cultures and show that the distribution deviates from an expected Poisson process.
DownloadHo, D.D., Neurmann, A.U., Perelson, A.S., Chen, W., Leonard, J.M., and Markowitz, M. (1995). Rapid turnover of plasma virions and CD4 lymphocytes in HIV-1 infection. Nature 373: 123-126.
This paper shows that AIDS is primarily the result of continuous and highly productive replication of the HIV-1 virus that leads to the death of CD4 lymphocytes. The authors thus suggest that antiviral-based AIDS treatment should start as early in the infection as possible to be successful.
DownloadActivity
To learn about Poisson processes and the results of Luria’s experiment, try the interactive Poisson Simulation Activity prepared by Hernan Garcia.
Introduction
One of the most remarkable features of living organism is their breathtaking variety. Whales weigh 130,000 pounds and reach lengths of 100 feet. Bacteria weigh one hundred trillionth of a pound and barely reach a length of one ten thousandth of a foot. Lice are nearly transparent, while peacocks display every color of the rainbow. Even within a species, the shape, size, and color of organisms differ dramatically. I would love to be 7 feet tall like Kevin Durant and play basketball for the Golden State Warriors. But, when I fly in an airplane, I am happy to be only 5-foot-8.
Are organisms with unimaginable traits hiding in the depths of the ocean, waiting to be discovered? Or, are new organisms likely to emerge that will transform how we live or think about life? An answer to these questions can come from an understanding of the origin of traits. Obviously, we get our traits from parents, who got their traits from our grandparents, who got their traits from our even more ancient ancestors. Indeed, understanding how organisms transmit their traits to their progeny has been a major quest of the field of genetics (see the Narrative on The Laws of Inheritance by Tilghman). However, since all life evolved from a common unicellular life form, almost all currently inherited traits, like my blond hair, must have formed de novo in an ancestor that then passed them onto the descendants.
We now know that new heritable traits are generated by spontaneous mutations. Mutations are random changes in the sequence or arrangement of DNA that occur in almost every cell division in every organism on Earth. Mutations occur because the processes that duplicate, repair and segregate DNA are inherently imperfect and because changes in the environment damage DNA. Occasionally, spontaneous mutations alter gene function that leads to new traits.
The inevitable and ubiquitous occurrence of mutations may seem disconcerting. However, mutations allow biological hedge betting. The spontaneous mutations in most individuals do not change gene function. This majority of individuals will propagate existing traits to their off-spring, which ensures the survival of the species. A minority of individuals, however, acquires spontaneous mutations that generate new traits. In rare cases, one of these new traits will make the individual more fit in the current or new environments. These more fit individuals expand the species’ biological potential. In essence, the evitable but low rate of spontaneous mutations is critical to the mechanism of evolution in both sustaining and adapting life to new environments
In this Narrative, we will begin our exploration of mutations and new trait formation by studying experiments from the iconic scientific publication by Salvador Luria and Max Delbrück. Published in 1943, their experiments provided the first compelling evidence that spontaneous mutations were the underlying cause of new trait formation.
Why start with such an old experiment? Luria and Delbrück made their remarkable discovery not through the study of DNA, as it was yet to be discovered as the genetic material (an important experiment implicating DNA as the genetic material occurred in a year later in 1944; see white board video on the Avery, MacLeod, McCarty experiment). Rather, they used simple mathematical methods to analyze the de novo formation of a bacterial trait - resistance to viral infection. The elegance of their logic and compelling outcome of their experiments not only wowed me but every scientist I know, making their 1943 publication among the most revered in biology. The discovery was of sufficient importance that it resulted in a Nobel Prize awarded to Luria and Delbrück in 1969.
A description of the Luria and Delbrück experiments can be found in most biology textbooks. However, a more in-depth study of their journey to discovery provides so many additional gems about the process of science, which we can explore together. How does controversy shape scientific thought? What are the origins of scientific creativity and out-of-the-box thinking that overcome technical and conceptual hurdles? How does scientific rigor drive experimental design and interpretation?
But perhaps the most important reason to start with the Luria and Delbrück experiment is that their discovery of spontaneous mutations and their quantitative methodology continue to influence biological research. In Part II (Knowledge Overview), we will learn about the physical nature of mutations and how they alter the genetic codes in ways that can impact gene function. Then, in Part III (Frontiers), we will use this knowledge, coupled with the quantitative mindset of Luria and Delbrück, to understand the successful development of a drug cocktail treatment for AIDS (arguably one of the greatest medical success stories ever) and the unfortunate failed development of chemotherapy cocktails to cure cancer. In the Closing Thoughts, we will use our understanding of spontaneous mutations to explore two questions: Who is more evolved — man or bacteria? And where should you, as the next great explorer, look for new mind-boggling traits?
Part I: Journey to Discovery —
Spontaneous mutations underlie biological traits
The Problem
Attempts to explain the origin of new traits led to one of the big controversies in the history of genetics. In 1809, Jean-Baptiste Lamarck proposed the Induced Mutation Model: changes in the environment induced an adaptive mutation in the hereditary material of an organism that helped it survive. A giraffe had a neck appropriate to allow it to reach tree leaves. As trees grew taller, the giraffe stretched its neck to reach the leaves. This stretching induced a mutation, a change in giraffe’s hereditary material, so that the longer neck would be passed on to its progeny.
Followers of Darwin, however, proposed the Spontaneous Mutation Model for new traits. They posited that mutations were occurring all the time, independent of the environment. A subset of these mutations manifested as new traits in the progeny (a new leaf type in a plant or the beak size in a bird; Figure 1).
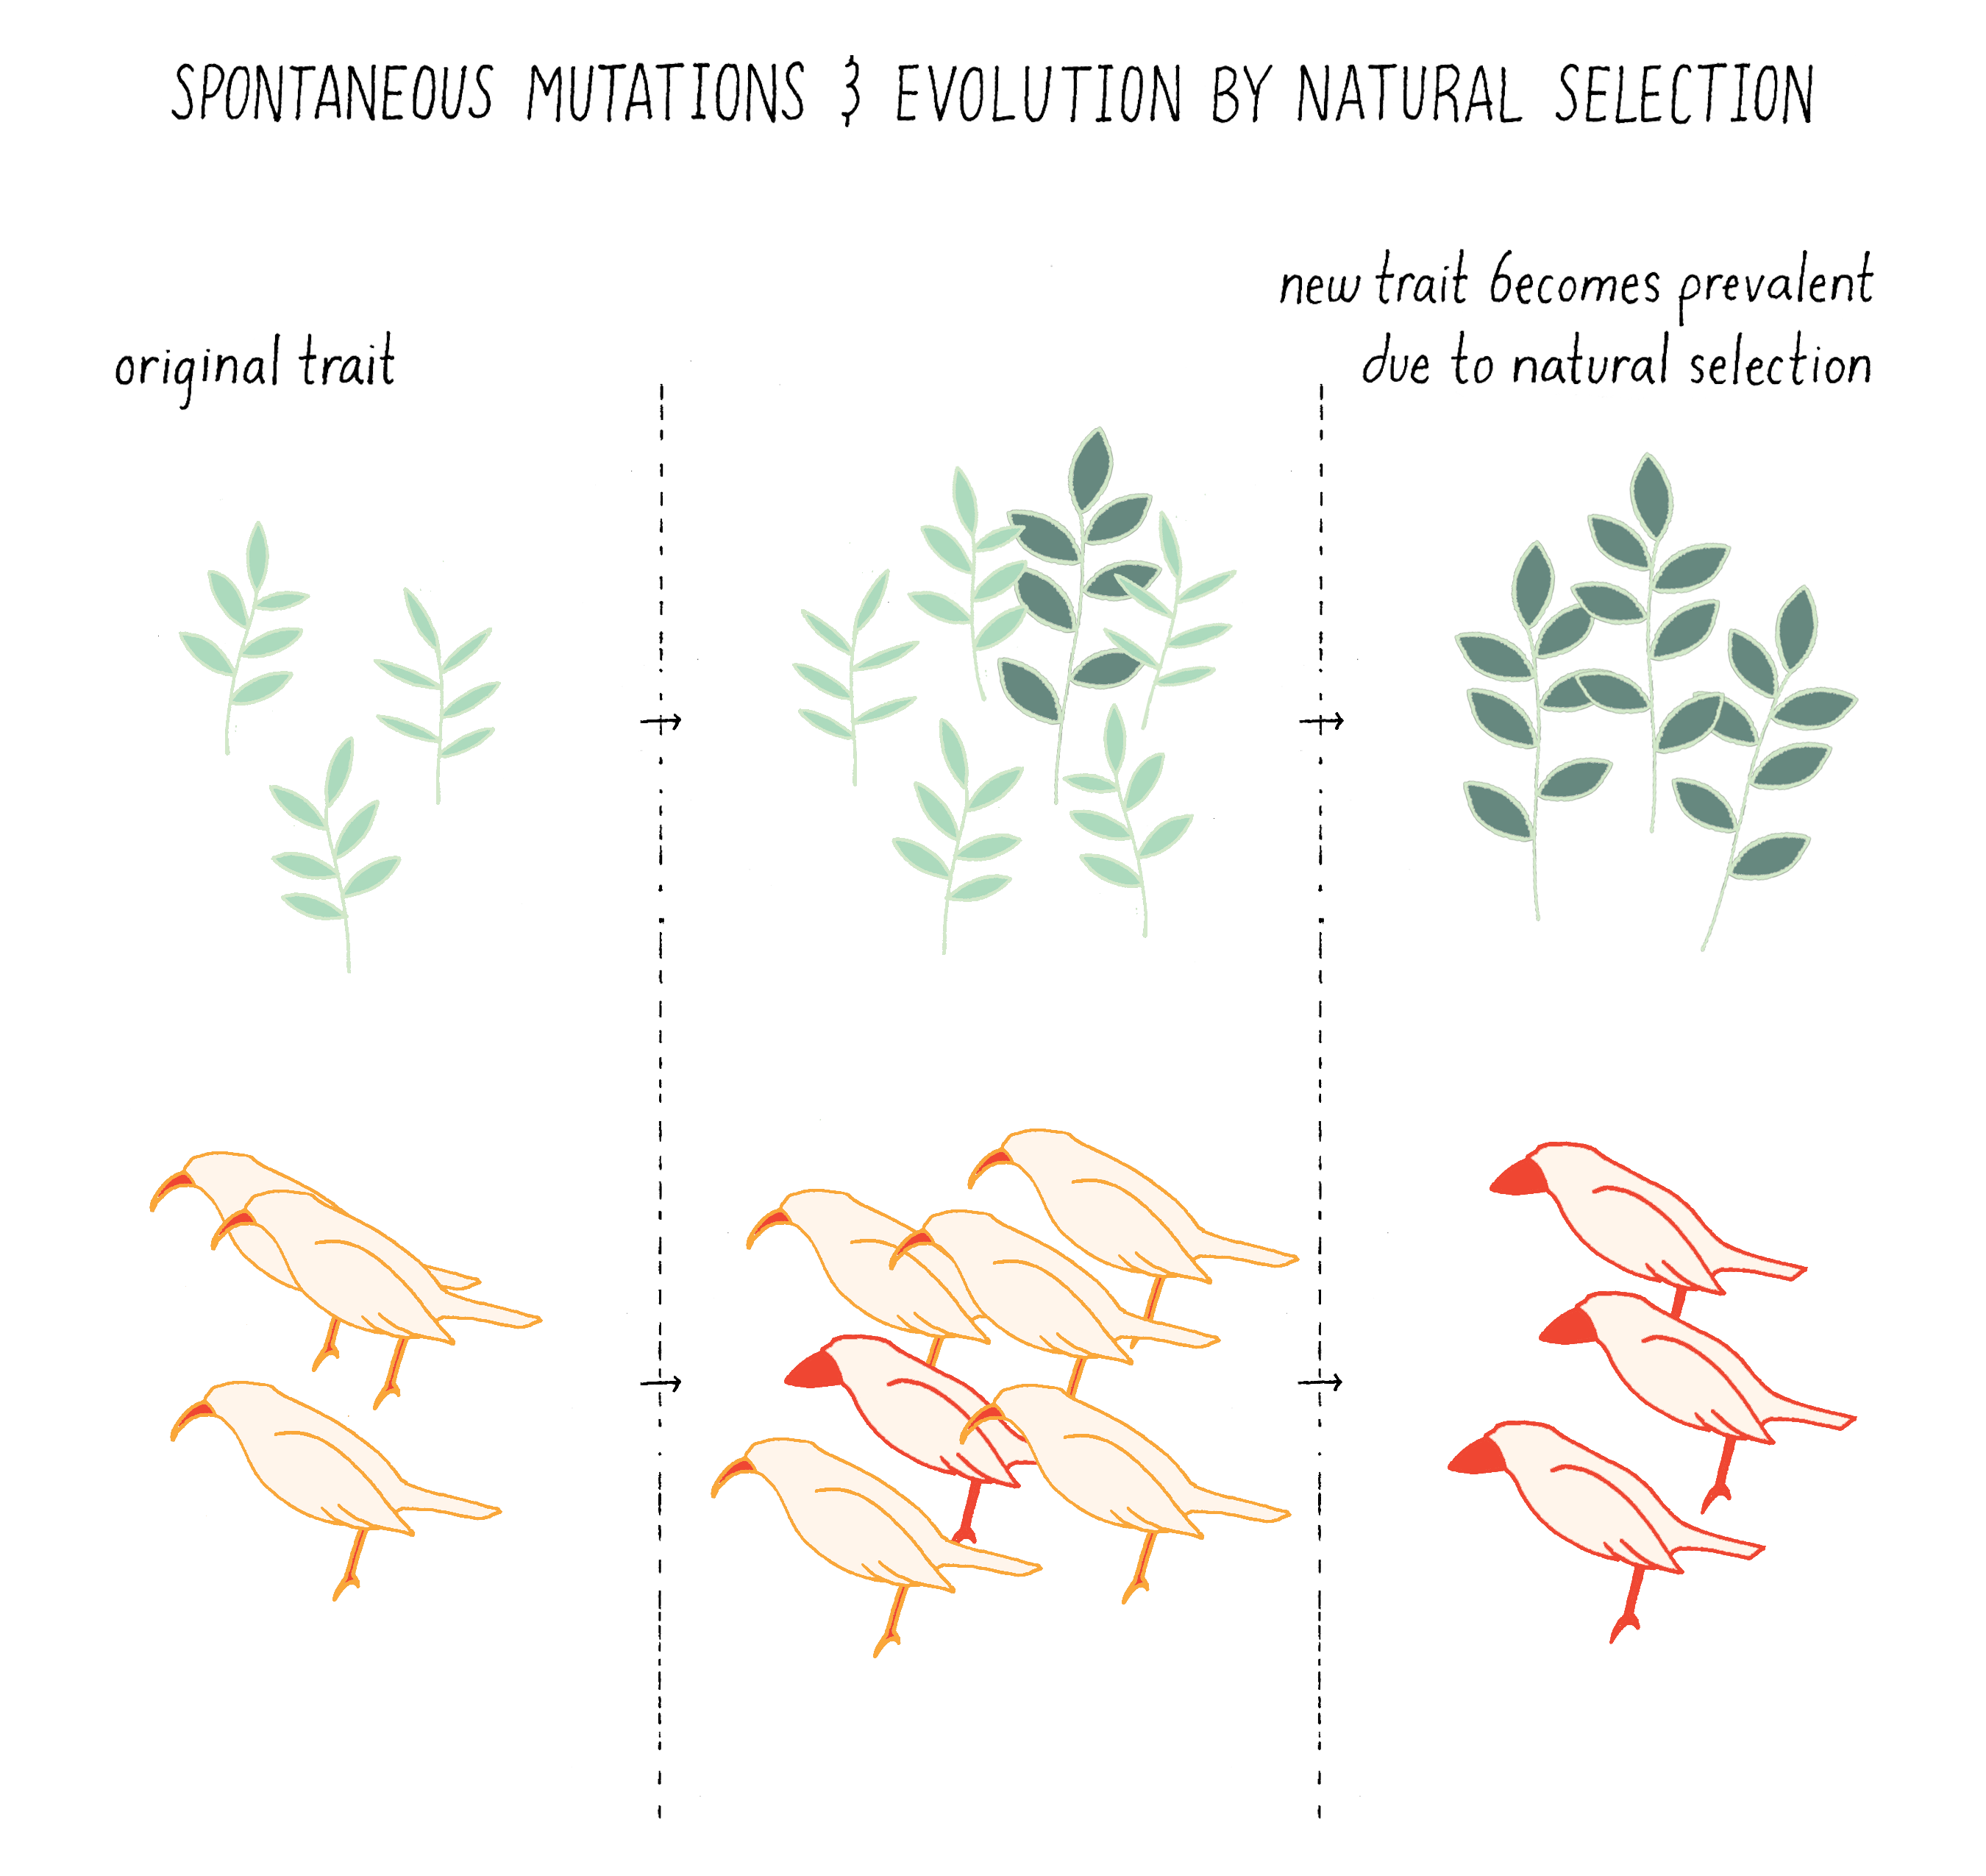
If the trait was favorable for survival under the existing or new environmental condition, then the altered progeny had a selective advantage that allowed them to persist and become prevalent among the population. In contrast to view of Lamarck, a fortuitous spontaneous mutation in the sperm or egg of a giraffe caused its progeny, and subsequent generations, to grow up to have longer necks even when the trees were short. These longer-necked giraffes had a greater chance of survival if trees in their environment grew taller (Video 1).
The concept of “evolution” was largely accepted at the turn of the 20th century. By this time, embryologists had discovered that cells of plants and animals that carried the hereditary information (pollen/sperm and ovules/ eggs) were housed in specialized organs. As a result, these cells had limited exposure to many environmental changes that would be necessary to induce favorable mutations as proposed by the Induced Heredity Model. However, other experiments that purported to support this model continued to be published until 1930’s. Proof of the origin of mutations remained unsettled until 1943 (the year of the Luria experiment described in this Narrative). The hurdles that prevented scientists from resolving this controversy were three-fold (Video 2).
1) They needed a population that lacked a trait and the capability to detect its de novo appearance in a few individuals of the population.
2) They needed to be able to demonstrate that this new trait was heritable, that it passed from parent to offspring. A permanently bent arm from an improperly healed broken arm is a new but not a heritable trait.
3) They needed some means of assessing when the trait appeared. Did it arise before any change in the environment that might have caused its appearance? Or did a change in the environment induce the new trait to form?
Finding a biological system that overcame these three hurdles appeared to be a tall order. The Journey to Discovery describes how one scientist, Salvador Luria, thought of an experiment that overcame these barriers and led to a Nobel Prize. The first clue describes how Luria’s choice of model organisms overcame the first two hurdles. The second clue describes Luria’s insight that led him to surmount the third hurdle by performing a brilliant experiment.
Clue
Clue 1: Bacteria and phage could be used as a model system to study the origin of traits
Luria thought that bacteria would be the best biological system to study the origin of traits. Bacteria are single cell microbes called prokaryotes that produce progeny by asexual cell division. If you are asked whether you want your net worth to be equal to the richest man on Earth (Jeff Bezos, ~100 billion dollars), or equal to the number of bacteria on Earth, take the second choice. About 5 million trillion trillion bacteria (5 followed by 30 zeroes) inhabit the Earth! Many bacteria divide every 20 minutes; thus between breakfast and dinner (~12 hours), a single bacterium will give rise to 36 generations of progeny, generating ~68 billion of descendants (236 bacteria)! In contrast, humans have taken over 70,000 years to generate 7 billion people. Clearly with bacteria, Luria could easily assess the appearance of rare traits in a large number of descendants that derived from a single common ancestor.
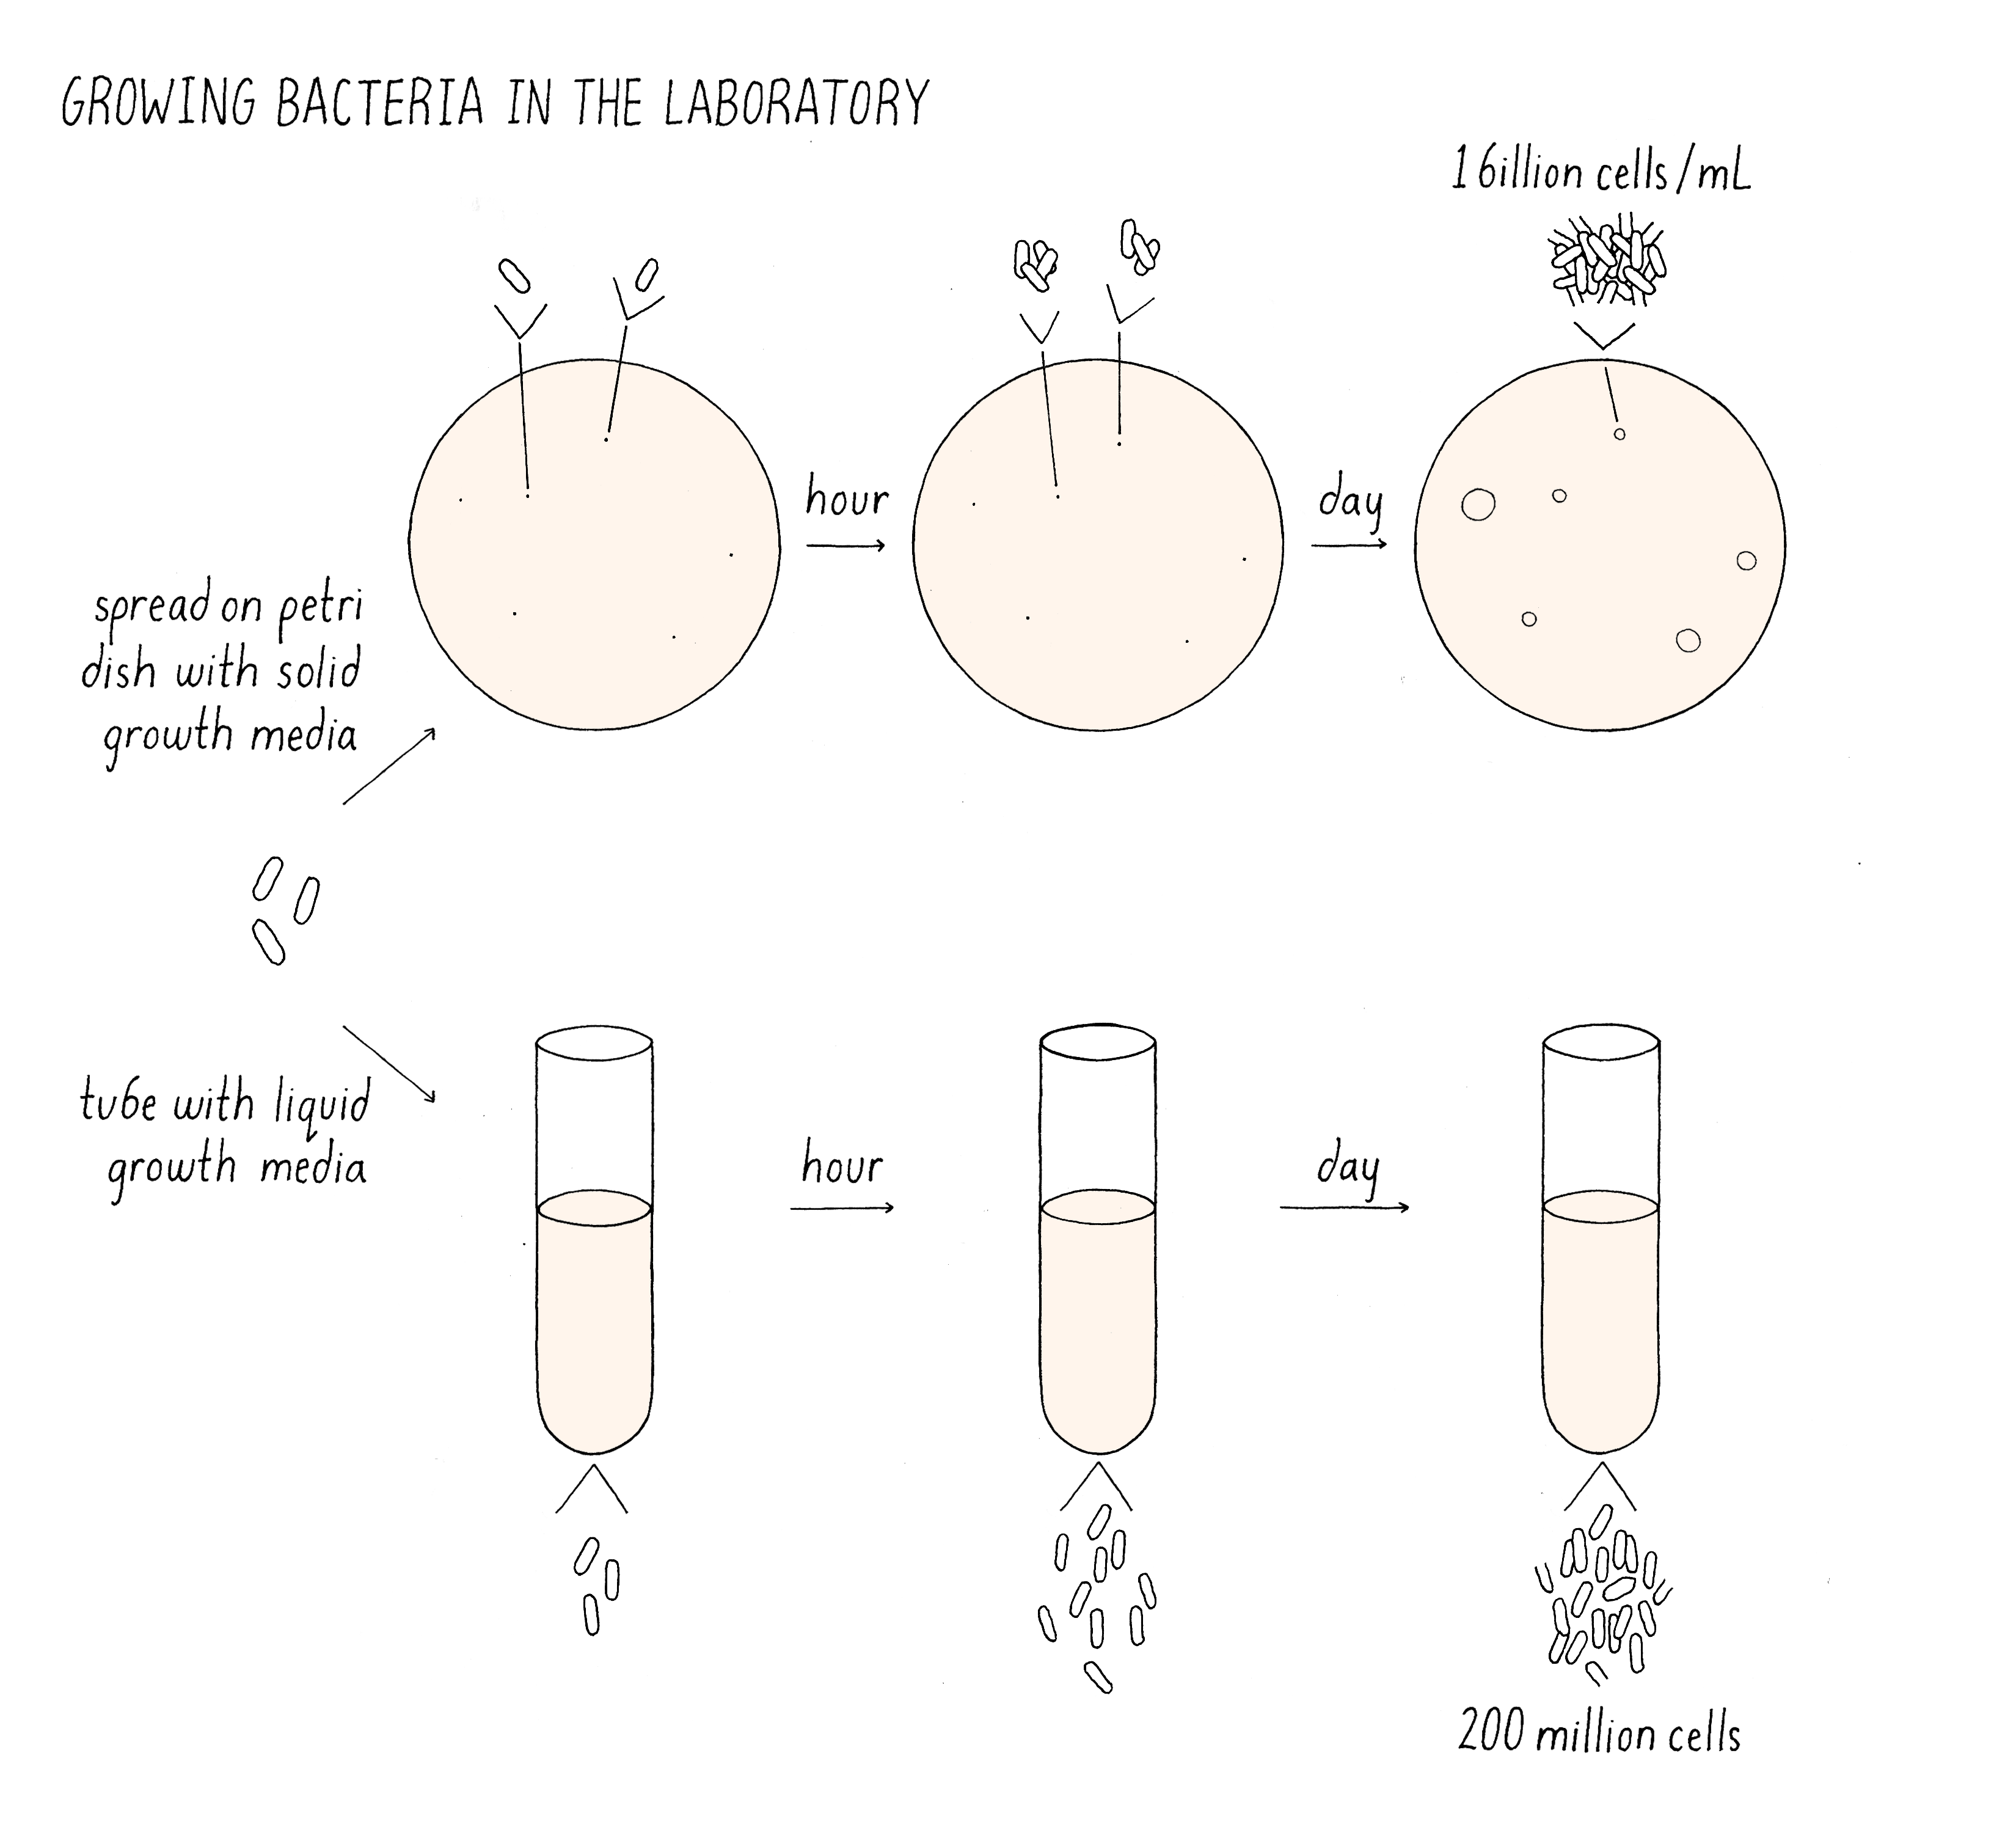
The cultivation of bacteria is easy. Cultures of bacteria can be grown in liquid media (Figure 2). Here, when a cell divides, the two daughter cells float apart mixing with the other cells that are dividing in the culture. The dispersed cells continue to divide, reaching densities of 109 (one billion) bacteria per milliliter before they consume all the food in the media and stop growing. Alternatively, bacteria can be placed on the top of a plate of agar containing nutrients. A single bacteria placed on the agar plate will divide and divide and form a mound of cells, which are called colonies. When colonies contain 200 million cells, they are easily visible by eye. The colonies provide an easy readout for the viability of any cell placed on the plate.
Explorer’s question: You are given a culture of bacteria. You place a drop of the culture onto a special microscope slide with a grid which allows you to count bacteria in 0.0001 ml. You count 350 bacteria. You also dilute the culture 1/10,000 fold and spread 0.1 on an agar plate. After a day, 25 colonies appear. Calculate the number of cells per ml in the original cells in the culture by the using the microscope and colony assay. Provide an explanation why they might be different.
Answer: For the microscope, if there are 350 cells in 0.0001 ml of the culture, there must be 10,000 times this number in 1 ml of the original culture or 3.5 × 10⁶. For the microscope, if there are 25 cells in 0.1 ml of the dilution, there must be 10 times this number in 1 ml of the dilution or 250. This ml is 1/10,000 the concentration of the original culture, so the bacteria/ml of the original culture is 250 × 10,000/ml or 2.5 × 10⁶. The colony and microscope assays generate different answers for the number of bacteria in the culture because in the microscope assay, all bacteria in the culture are counted whether they are alive or dead. The plate assay only counts cells that are alive and can form a colony. These results would suggest that only ~2/3 of the cells in the culture are alive. The other possibility is inaccuracies in your experimental technique. Perhaps you did not spread all of the bacteria evenly on the plate, with a clump of 2 or 3 bacteria producing a single colony? As you will see later, Luria was concerned about the possibilities of such experimental errors before he made any conclusions about his experiments.
Now Luria needed a “trait” to study in the bacteria. He decided to look at a rare trait of bacteria becoming resistant to a virus (Video 3).
Like humans, bacteria are attacked by many different types of viruses called bacteriophage, or phage for short (Figure 3). Depending upon the type of phage, a phage can cause no symptoms in the bacteria, mild symptoms, or death. Phage thrive because bacterial hosts are everywhere and abundant. Indeed, these are estimated to be 10 times more phage on Earth than the already astronomical number of bacteria!
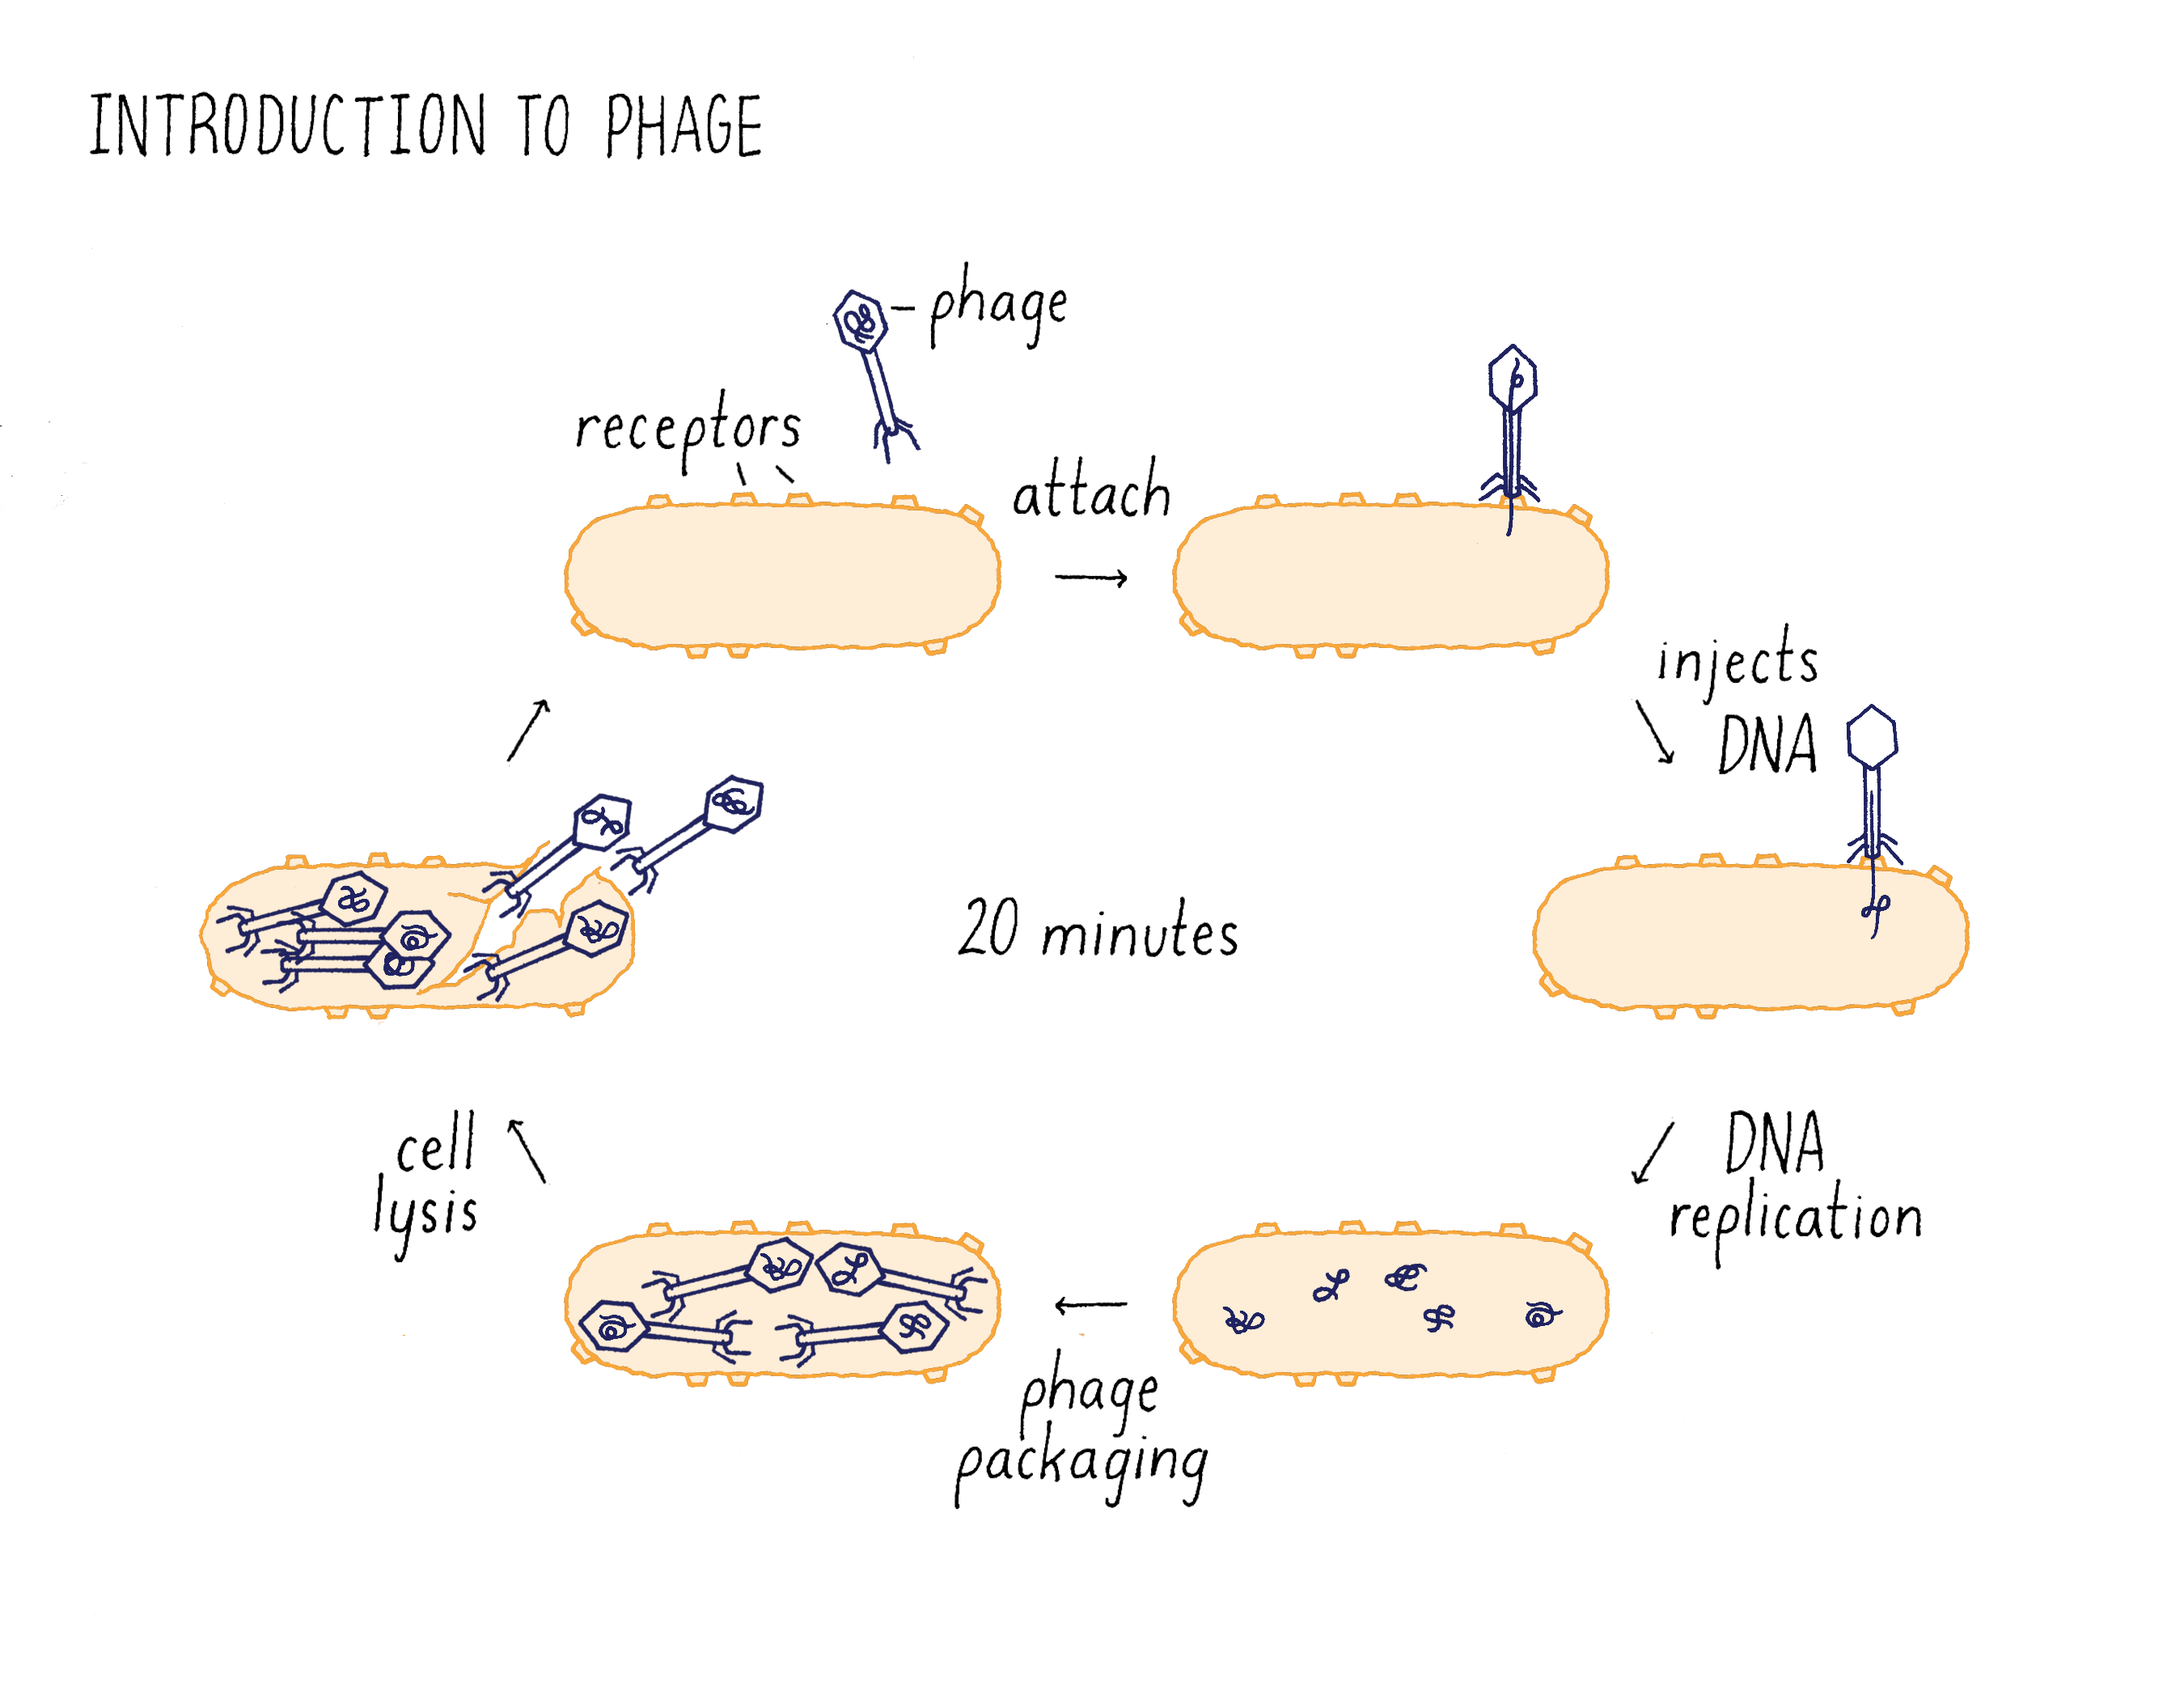
One particularly virulent phage is T1 (Figure 3). T1 has a small genome of DNA that is encapsulated in small protein case called a capsid. T1 binds to receptor proteins on the surface of the bacterium species, Escherichia coli (or E. coli, a species of bacteria that lives in the human intestine and is widely used for research), and injects its DNA into the cells. The phage DNA replicates when inside the bacterium and directs the synthesis of phage proteins that assemble with the DNA to generate many new T1 phage. The T1 DNA also directs the synthesis of an enzyme that destroys the bacterial membrane, so the progeny phage can escape its host. The released T1 progeny then absorb to other bacteria, and begin the infection process all over again. The infection process takes only 20 minutes from the initial adsorption to the cell surface to release of progeny! (Dig Deeper 1: Is a bacteriophage a living organism?) In the remainder of this Narrative, we will just use the word “phage” to refer to the T1 bacteriophage
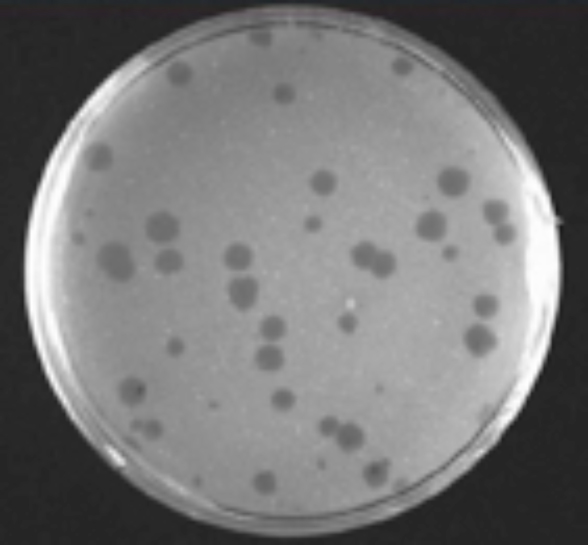
Explorer’s question: If one spreads a million bacteria over the surface of a plate, each of the million cells will divide to produce a colony generating a million colonies. These colonies are so close together that they fuse together to produce a uniform lawn of bacteria on the plate. Imagine that a single phage is placed in the center of the plate at the same time the million bacteria are spread on the plate to initiate lawn formation. What do you think you will see in the bacterial lawn once it is formed?
Answer: One would see a single round clear hole in the lawn resulting from the phage infection (Figure 4). The phage infects a bacterium, replicates and kills the initial cell. Its progeny infect neighboring cells. The process is repeated and spreads outwards, in a radial pattern of killing. This radial killing leaves a round clear hole of lysed dead bacteria, surrounded by a lawn that is formed by the uninfected bacteria. This hole is called a “plague.” Ten plaques will form if ten phage are placed randomly on the plate with the bacteria. Thus one can determine the number of phage in any solution by placing an aliquot of the solution onto a plate with its bacterial host and simply counting the number of plaques that form. This same method can be used to determine the number of animal viruses in a solution or from the blood of its host except one uses animal cells for the lawn instead of bacteria.
Luria knew that rare bacterial cells were resistant to phage killing, because these bacteria acquired a mutation that eliminated the receptor proteins, thereby preventing the phage from grabbing hold of the bacteria. He thought that this trait of phage-resistant might be well suited to determine how new traits originate. Luria could find phage-resistant cells with the following simple experiment. Phage are spread out uniformly on an agar plate, and then, a solution of bacteria is placed on top. All of the bacteria will die due to phage infection. However, if there is a very rare “mutant” bacterium present in the population that acquired resistance to the phage, then it will live and divide. Eventually, it will divide a sufficient number of times to produce a visible bacteria colony – evidence of a survivor in a sea of death (Figure 5).
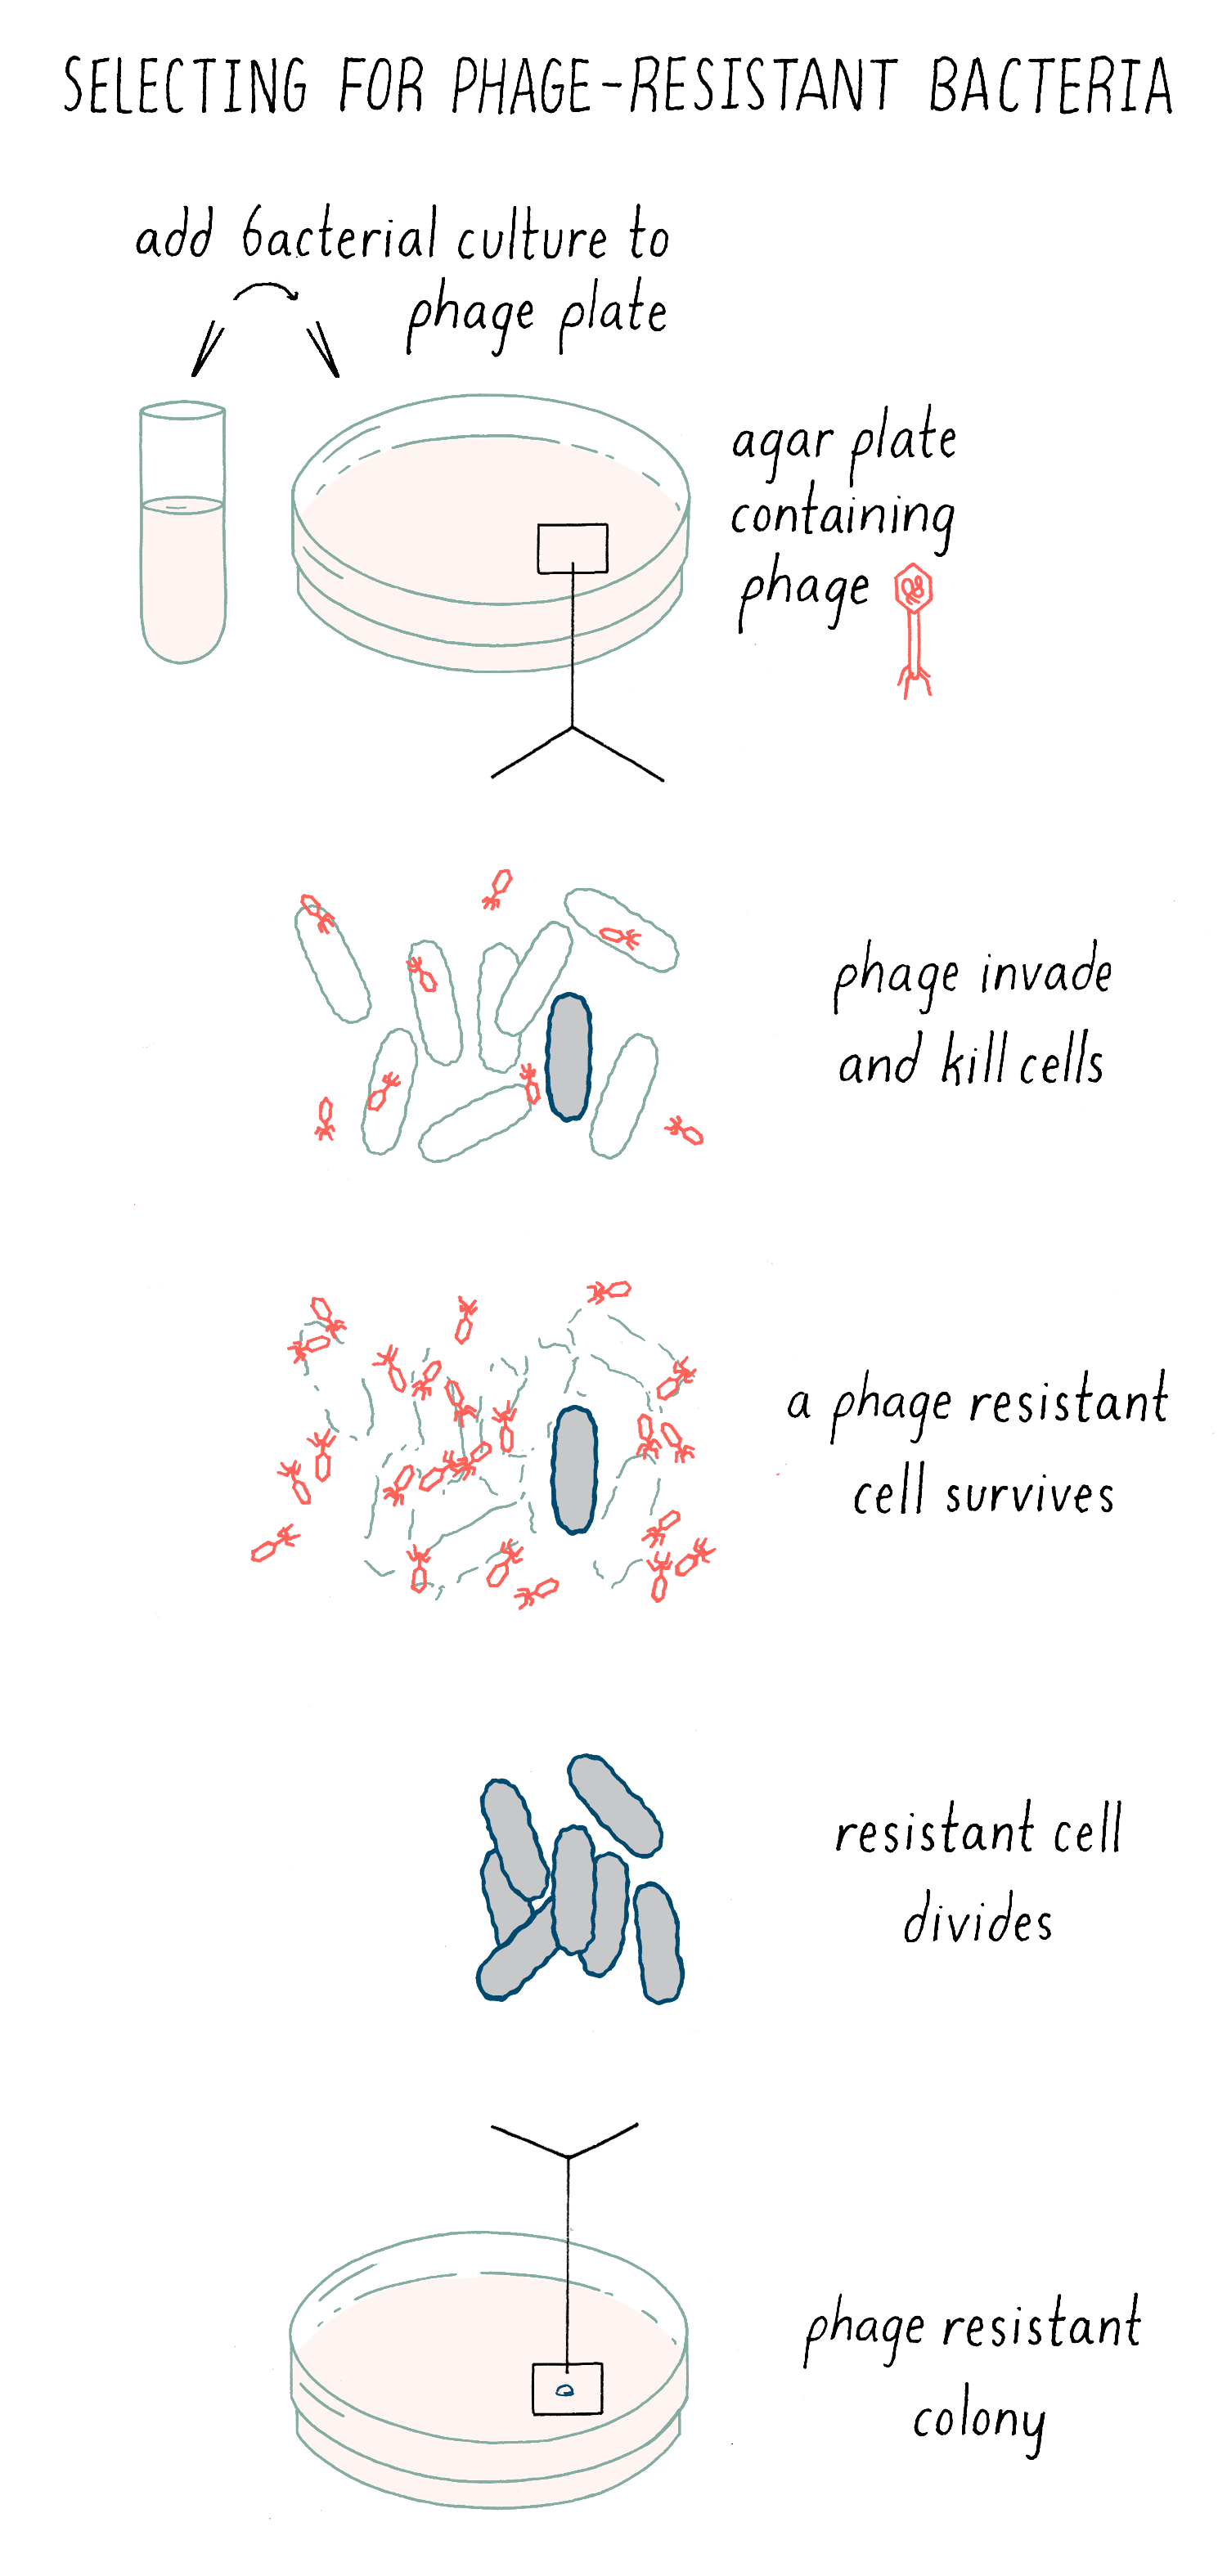
Explorer’s question: Imagine the formation of two new traits of bacteria: 1) resistance to phage infection or 2) a change in the shape of the bacteria from a rod to a sphere. Which would you choose to study and why?
Answer: The formation of new traits is a very rare event, so it is like trying to find the proverbial needle in a haystack. If you are trying to identify a new shape, you would have to spend a lot of time looking through a microscope to find a bacterium that was different in shape. With phage resistance, the phage is doing all of the work for you! It is killing all of the parents and leaving behind the very rare progeny that you are looking for.
These experiments provided a means of detecting the appearance of the new trait of phage resistance in rare bacterial descendants and showed the heritability of this trait. Why hadn’t others before Luria seized upon this system?
Many scientists thought that Luria was wasting his time, because bacteria were odd beasts and anything that you might learn would not be relevant for understanding problems concerning heredity. These scientists argued asexual bacterial division, and sexual reproduction involving male and female gametes, a process necessary for Mendelian inheritance (see the Narrative on The Laws of Inheritance by Tilghman), reflected completely unrelated forms of heredity; in fact some argued that bacteria may not even have genes (remember that the time, it was not known that genes were made of DNA).
Quotes from two renowned scientists exemplified the disparate views about the relevance of bacteria as a model for inheritance and trait formation.
Julian Huxley wrote1, “Bacteria ... appear to be not only wholly asexual but premitotic. Their hereditary constitution is not differentiated into specialized parts with different functions. They have no genes in the sense of accurately quantized portions of hereditary substance; and therefore they have no need for the accurate division of the genetic system which is accomplished by mitosis. ... That occasional ‘mutations’ occur we know, but there is no ground for supposing that they are similar in nature to those of higher organisms, nor, since they are usually reversible according to conditions, that they play the same part in evolution. We must, in fact, expect that the processes of variation, heredity, and evolution in bacteria are quite different from the corresponding processes in multicellular organisms.”
1J. Huxley, 1943, Evolution: The Modern Synthesis, New York: Harper & Brothers Publishers, pp. 131–132
In contrast, Theodosius Dobzhansky wrote2,
“Most of these [bacterial variations] can be simply accounted for on the assumption that a variety of [gene] mutations arise, each with a certain frequency, in bacterial strains. In any given environment a certain biotype or biotypes are selected to become the dominant components of the culture. ... Although some bacteriologists are prone to believe that the behavior of bacteria is incompatible with established concepts of genetics and evolution theory, there are valid reasons to think that bacteria may prove to be the best available materials for exact studies on mutation and natural selection.”
2T. Dobzhansky, 1941, Genetics and the Origin of Species, New York: Columbia University Press, pp. 189–190
As we will see, Theodosius turned out to be right about both the relevance of bacteria inheritance to animals and the potential of bacteria as a future model system to study genes and mutations.
For students, this may seem like irrelevant history, but there are two important lessons here. First, the Huxley quote was included not to disparage him. Our understanding of nature is constructed from the limited knowledge at the time, particularly in new fields. As a result, models will inevitably evolve as new facts emerge (some of the models found in textbooks today will be overturned in the future). Thus, there was no shame for Huxley, a very smart scientist, for making a reasonable, albeit wrong, interpretation of the existing facts. Rather the quote reminds us that pushing the envelope in research means being wrong sometimes. Scientists who are not afraid to be wrong make big discoveries. Lots of Nobel Prize winners also have been wrong plenty of times in their careers!
Given that bacteria were a controversial model for inheritance at the time, Luria was bold to pick bacteria to address the origin of traits controversy. The exploration of “unpopular” biological systems remains relevant today. In 30 years, every human will have his or her DNA sequenced as a necessary tool for healthcare. This advance in health care is only possible because of polymerase chain reaction (PCR), an invention that came about because a few biologists were crazy enough to look for live bacteria in the near boiling thermal vents of Yellowstone.
Clue 2: The realization that the outcome at a slot machine might be similar to the outcome of phage-resistance colonies
As you probably noticed, Luria had only overcome two hurdles for resolving the controversy of the origin of traits. He had a de novo trait (phage resistance) that was heritable and easy to study. But the most difficult hurdle remained. He needed a method to detect when the mutation that gave rise to phage-resistant trait appeared – was it before the bacteria were exposed to the phage, or only after the bacteria were spread on the plate and exposed to phage? Answering this question was difficult because the phage-sensitive and phage-resistant bacteria were indistinguishable in appearance. The only way to detect phage-resistant bacteria was by their ability to proliferate and form a colony upon exposure to phage. Thus, the test for the resistance trait, in of itself, could be inducing phage resistance, confounding the ability to assess whether the resistant mutations pre-existed before the test.
A solution to this dilemma came to Luria not in the laboratory, but rather while he was watching a friend play a slot machine, getting nothing, nothing, and then suddenly winning a large jackpot. Luria suddenly realized that the “odds” (probability statistics) of gambling were pertinent to studying mutations, which were likely also random in nature. Most importantly, he had the insight that the logic of statistics and the infrequent nature of large jackpots could be used to differentiate between the two models for the origin of traits (definitely a nerd for thinking about science while gambling).
This eureka moment at the slot machine reveals two important elements of creativity in science. Luria was predisposed to appreciate the power of mathematics and quantitative thinking. He spent a year studying with physicists, including Enrico Fermi, after finishing his medical training! Many big discoveries in a field come from scientists with different backgrounds that inspire outside-the-box thinking about biological processes and problem solving. Second, serendipity, in this case being next to a slot machine at the right time, plays a big role in discovery.
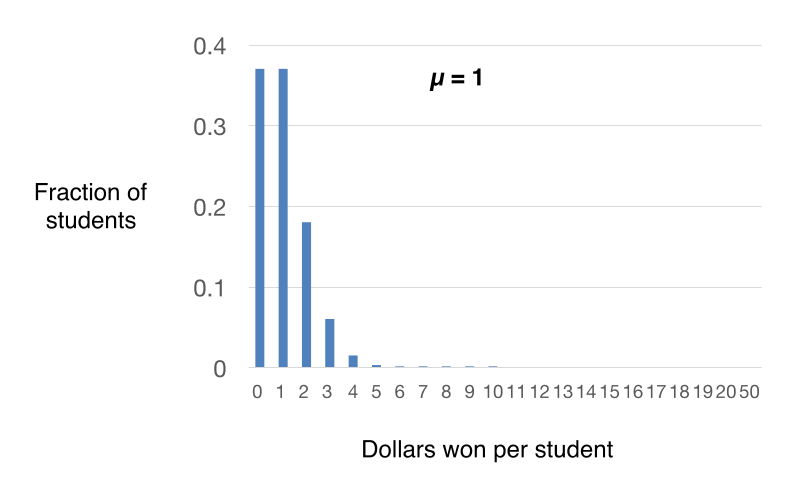
Before understanding why the slot machine inspired Luria, we first need to learn some simple math, developed by the French mathematician Simeon Denis Poisson1. Poisson derived a mathematical description of the probability of successful outcomes when the number of attempts, n, is high, the probability of success for each attempt is low and determined through a random process, and the probability of each attempt is independent of prior success or failure. As an example, imagine that I have 100 dollars that I want to generously distribute to the 100 students in my class. I give out one dollar at a time by drawing names out of a hat at random; after the student collects the $1, I put his/her name back in the hat so that student has an equal chance of winning in the next draw. The chance of winning is low per draw (1 out of 100) but there are 100 draws. Each chance has a low probability of your winning and independent of any previous winnings made earlier.
Explorer’s question: If you are student in the class, do you think that it more likely that you will win nothing ($0) or $1 after all 100 dollars are distributed?
Answer: The answer is both are equally probable, even though the mean is $1 per student ($100/100 students). We will do the calculation later in the mini-narrative.
Thanks to Poisson, we can go beyond our intuition and determine the distribution of winnings for the students in the class using the equation:
P(x) = e-mmx/x!
In this equation, x are different outcomes that you want to know the probability of occurrence; for example, different integers of x are the likelihoods of a student winning 0,1, 2, 3, 4 dollars, etc. P(x), therefore, is the probability of these different outcomes (note that P is expressed as a fraction; P =1 is 100% probability). m is the mean (the average) success (winnings) per student. In this case, $100 was distributed ($1 at a time) over 100 students. Thus m = $1 per student. “e” is a mathematical constant (2.718; natural logarithm base). x! is a “factorial” – the product of an integer multiplied by all of the integers below it. As described above, “x” is a particular outcome (e.g. 0,1, 2, 3, 4 dollars, etc).
As an example, let us calculate the probability of a particular student winning $2 upon 100 draws. In this case, m = 1 (see above) and x = 2 and we can substitute in the equation P(2) = e-1*12/2*1. The answer is 0.184.
Explorer’s question: Now let us go back and calculate the probability of a student winning nothing ($0) or a student winning $1.
Answer: The answer
surprisingly is that winning nothing is as
likely as winning $1, even though $1 is the mean
winning over all of the students. Note that 0!
is defined as equal to 1 (not 0).
P(0) =
e-110/1 = 0.37
P(1) = e-1*11/1 = 0.37
By plotting these calculated probabilities, we can get a sense of the expected distribution of winnings per student after all 100 dollars are distributed. In the example above, most students will win $0, $1 or $2. As you can see from the plot in Figure 6, the distribution of winnings among the students will be near the mean. And as a corollary, the probability of any student winning more than $10 becomes infinitesimally small (we will see why this is important later for Luria’s experiment). Because the drawing from the hat is “random”, the observed distribution of winning for my 100 students will approximate but not exactly match the theoretical distribution, because the number of chances is relatively small. If I randomly gave away 10,000 $1 bills to 10,000 students (the same mean of $1/student), then my result will likely look much closer to the theoretical distribution shown in Figure 6.
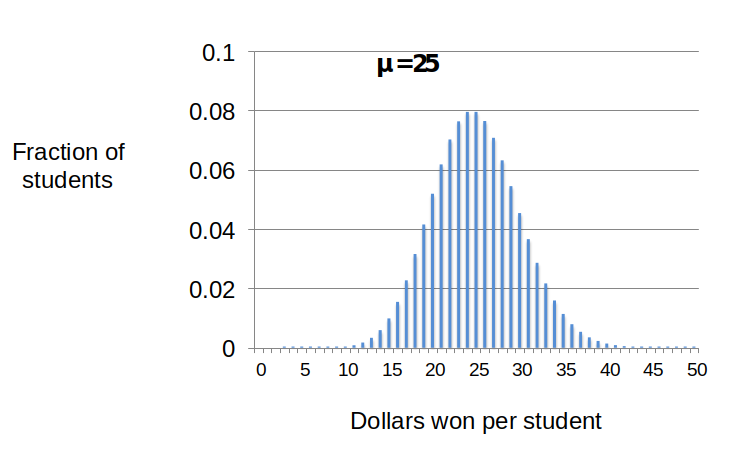
This general pattern repeats if I distribute 2500 one dollar bills to my 100 students (Figure 7). In this case, the mean winning per student (m) would be $25. When we use the Poisson equation (and a calculator) to predict the distribution of winnings, most students’ winnings will center around the mean of $25 with values between $15 and 35. The spread of the distribution relative to the mean can be expressed by a simple mathematic term called the “variance”(see Dig Deeper 2). For processes that generate Poisson distributions like the dollar giveaways, the variance is equal to the mean.
The occurrence of a winning combination on the slot machine (three of the same fruit) should be rare, random independent events; therefore the distribution of winning among gamblers should follow a Poisson distribution. As a result, the distribution of winnings to the gamblers should be similarly distributed around the mean. However, while standing next to the slot machine, Luria noticed that his friends’ winnings were nothing like a Poisson distribution. After an evening at the casino, most gamblers win nothing but a lucky few might win huge jackpots. These obvious huge fluctuations in payouts revealed that a seemingly Poisson process could be distorted, in this case by the casino. He reasoned that the generation of mutations to phage resistance in a culture were rare random independent events that should also be predicted by the Poisson function. However, like the slot machine, the number of phage-resistant bacteria in cultures could be distorted from a Poisson distribution depending upon whether phage resistance occurred – before or after the bacteria encountered its enemy, the phage. Truly a eureka moment! Which model (Induced or Spontaneous Mutation) did Luria predict would distort the Poisson distribution and how did he design an experiment to test his predictions? Let’s see!
The Discovery: Spontaneous Mutants Produce New Traits
Predictions made by the models
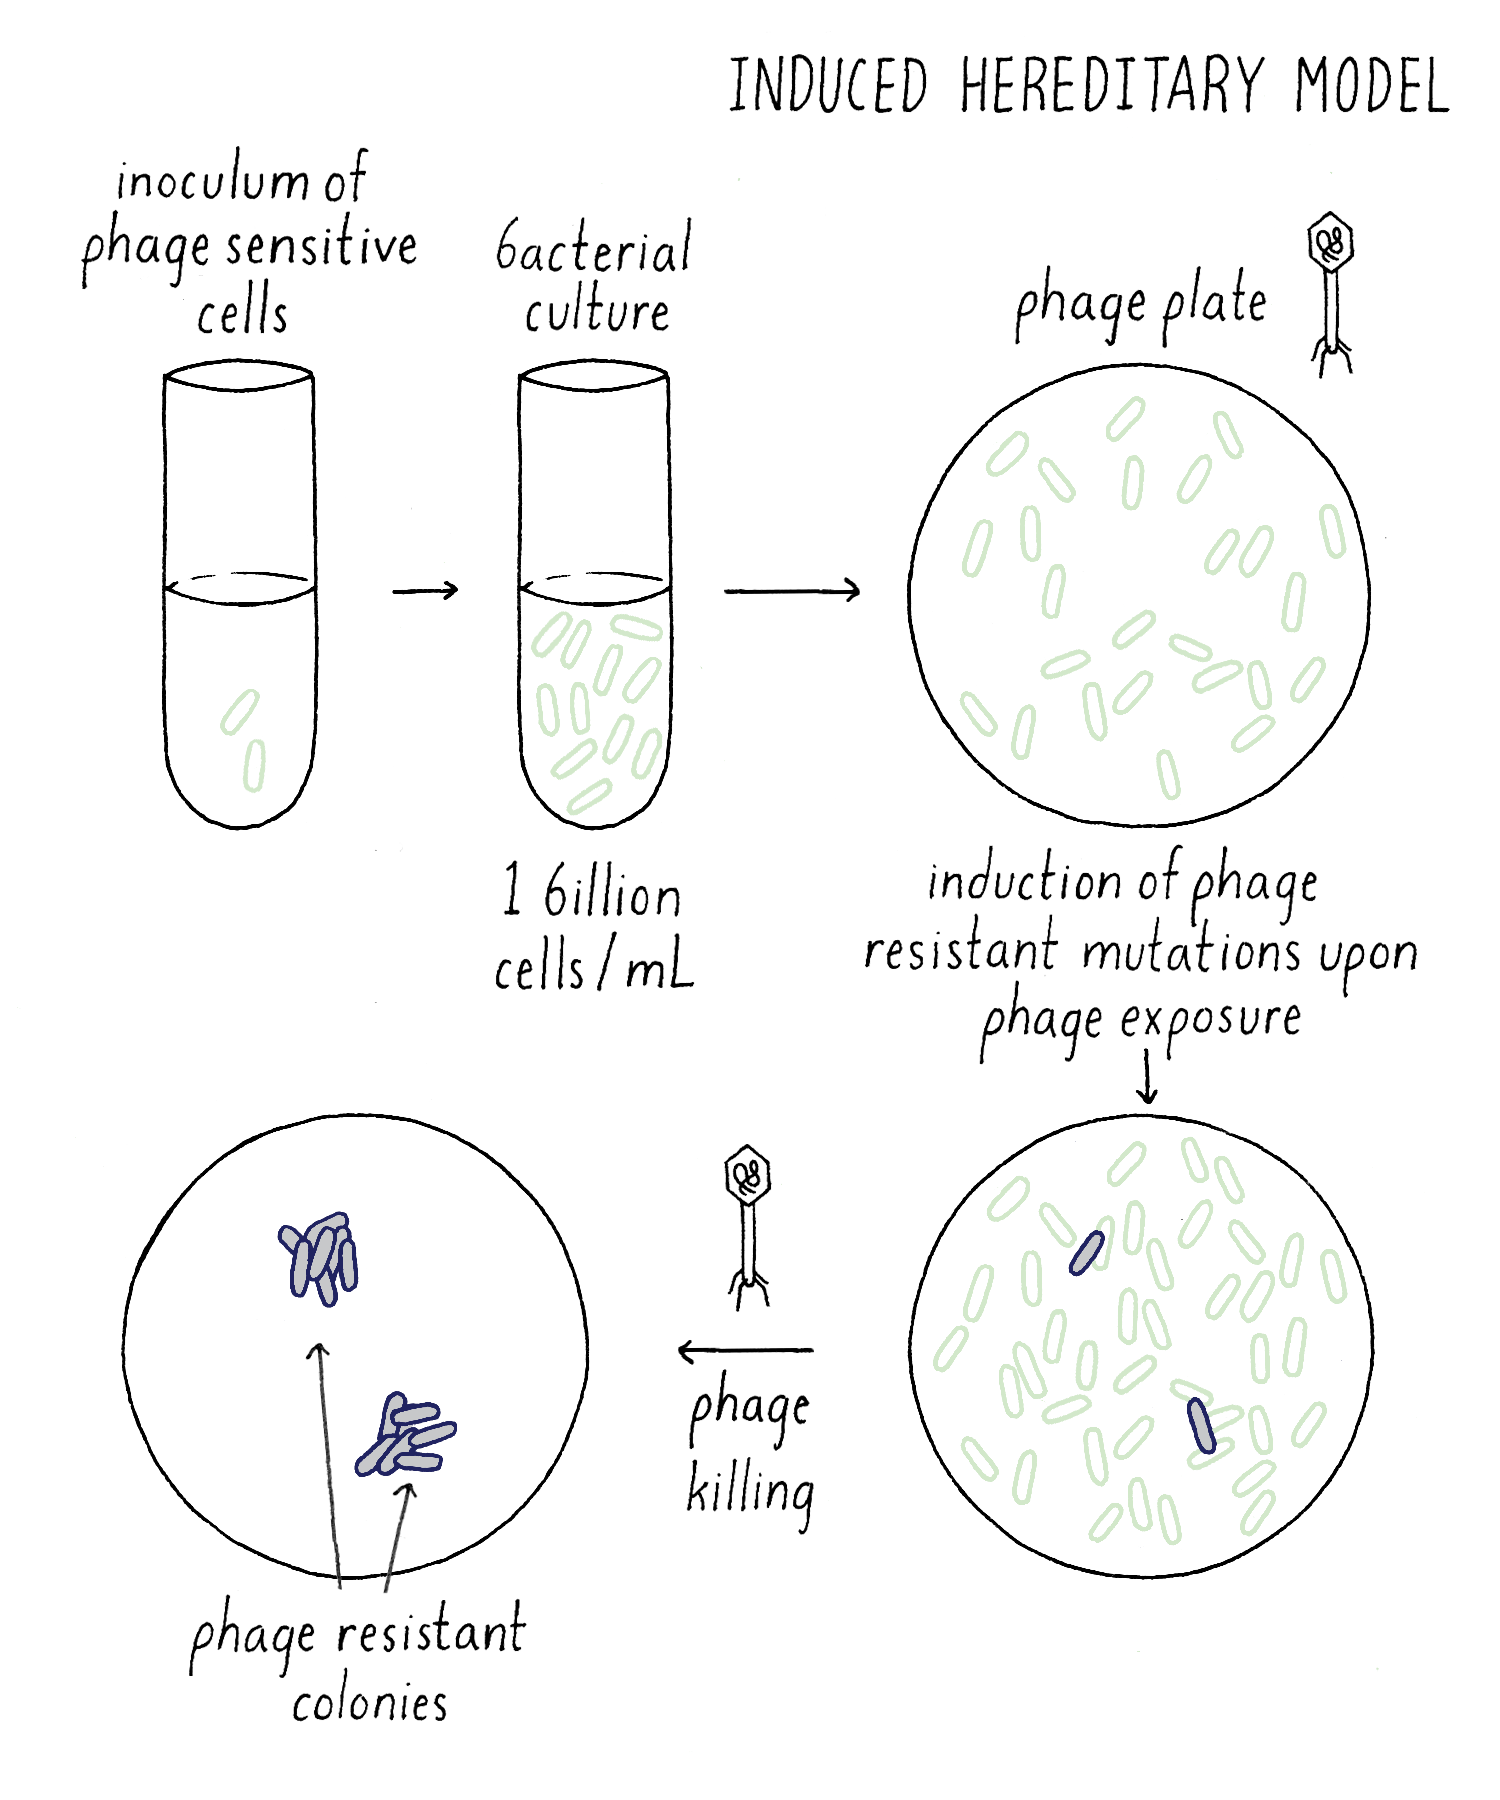
In the Induced Mutation Model, all bacteria would be initially phage-sensitive until the phage “acted” on them to induce mutations that would cause a lucky bacterium to become resistant (Figure 8). Say that the chance of this happening was one-in-a-billion (so extremely rare). However, thank goodness that bacteria are plentiful! As I described early, you can grow up one billion bacteria in one milliliter and add all one billion to an agar plate covered with phage. A giant massacre will ensue, as the phage happily invade, multiply and kill the bacteria. However, “on average,” one phage-resistant bacterium will emerge on a phage plate; it will grow and divide to form a bacterial colony. But because of the random nature of acquiring phage-resistance, we would expect a Poisson distribution. If we add billion bacteria each to 100 different phage plates, we would expect a distribution similar to my distributing 100 $1 bills to my one hundred students. Most phage plates will have 0, 1, or 2 phage-resistant bacterial colonies.
Explorer’s question: In one experiment, you grow up 100 billion bacteria in one liquid culture and distribute that single culture into your 100 phage plates (one billion cells per plate). In another experiment, grow up 100 separate liquid cultures, each to 1 billion cells and add each liquid culture to a separate phage plate. If the Induced Mutation Model is correct, would you expect the same result (a Poisson distribution of # phage-resistant colonies per plate)? Or a different result?
Answer: You would expect the same result. Becoming phage-resistant requires exposure to the phage and 1 billion sensitive cells were added to the phage plate in both experiments. It should not matter how you grew up the bacteria beforehand, in one culture or many. As you will see below, this is not the case if the Spontaneous Mutation Model is right.
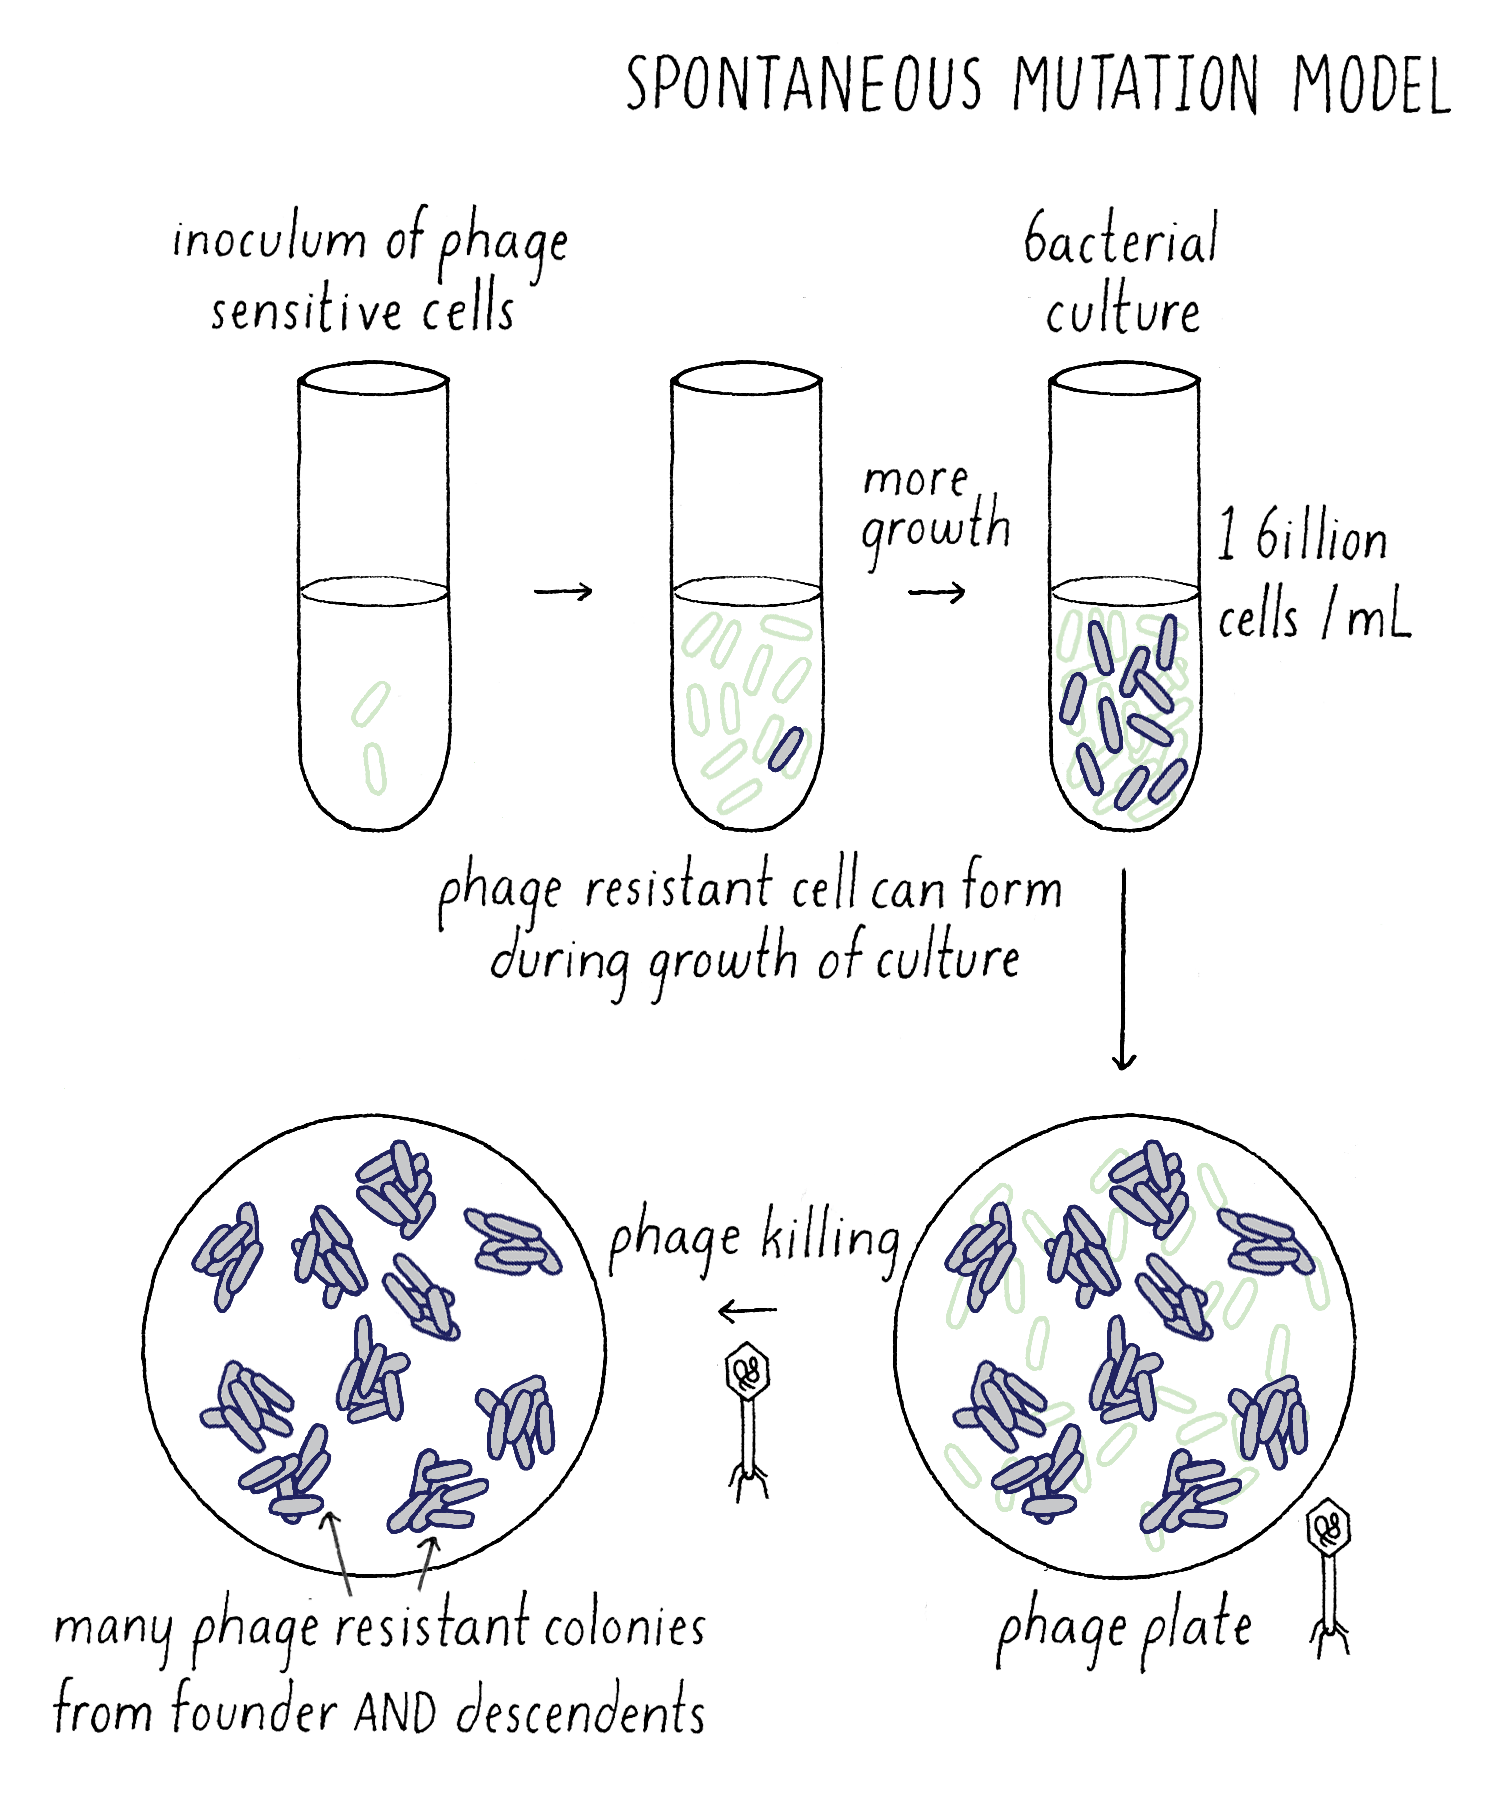
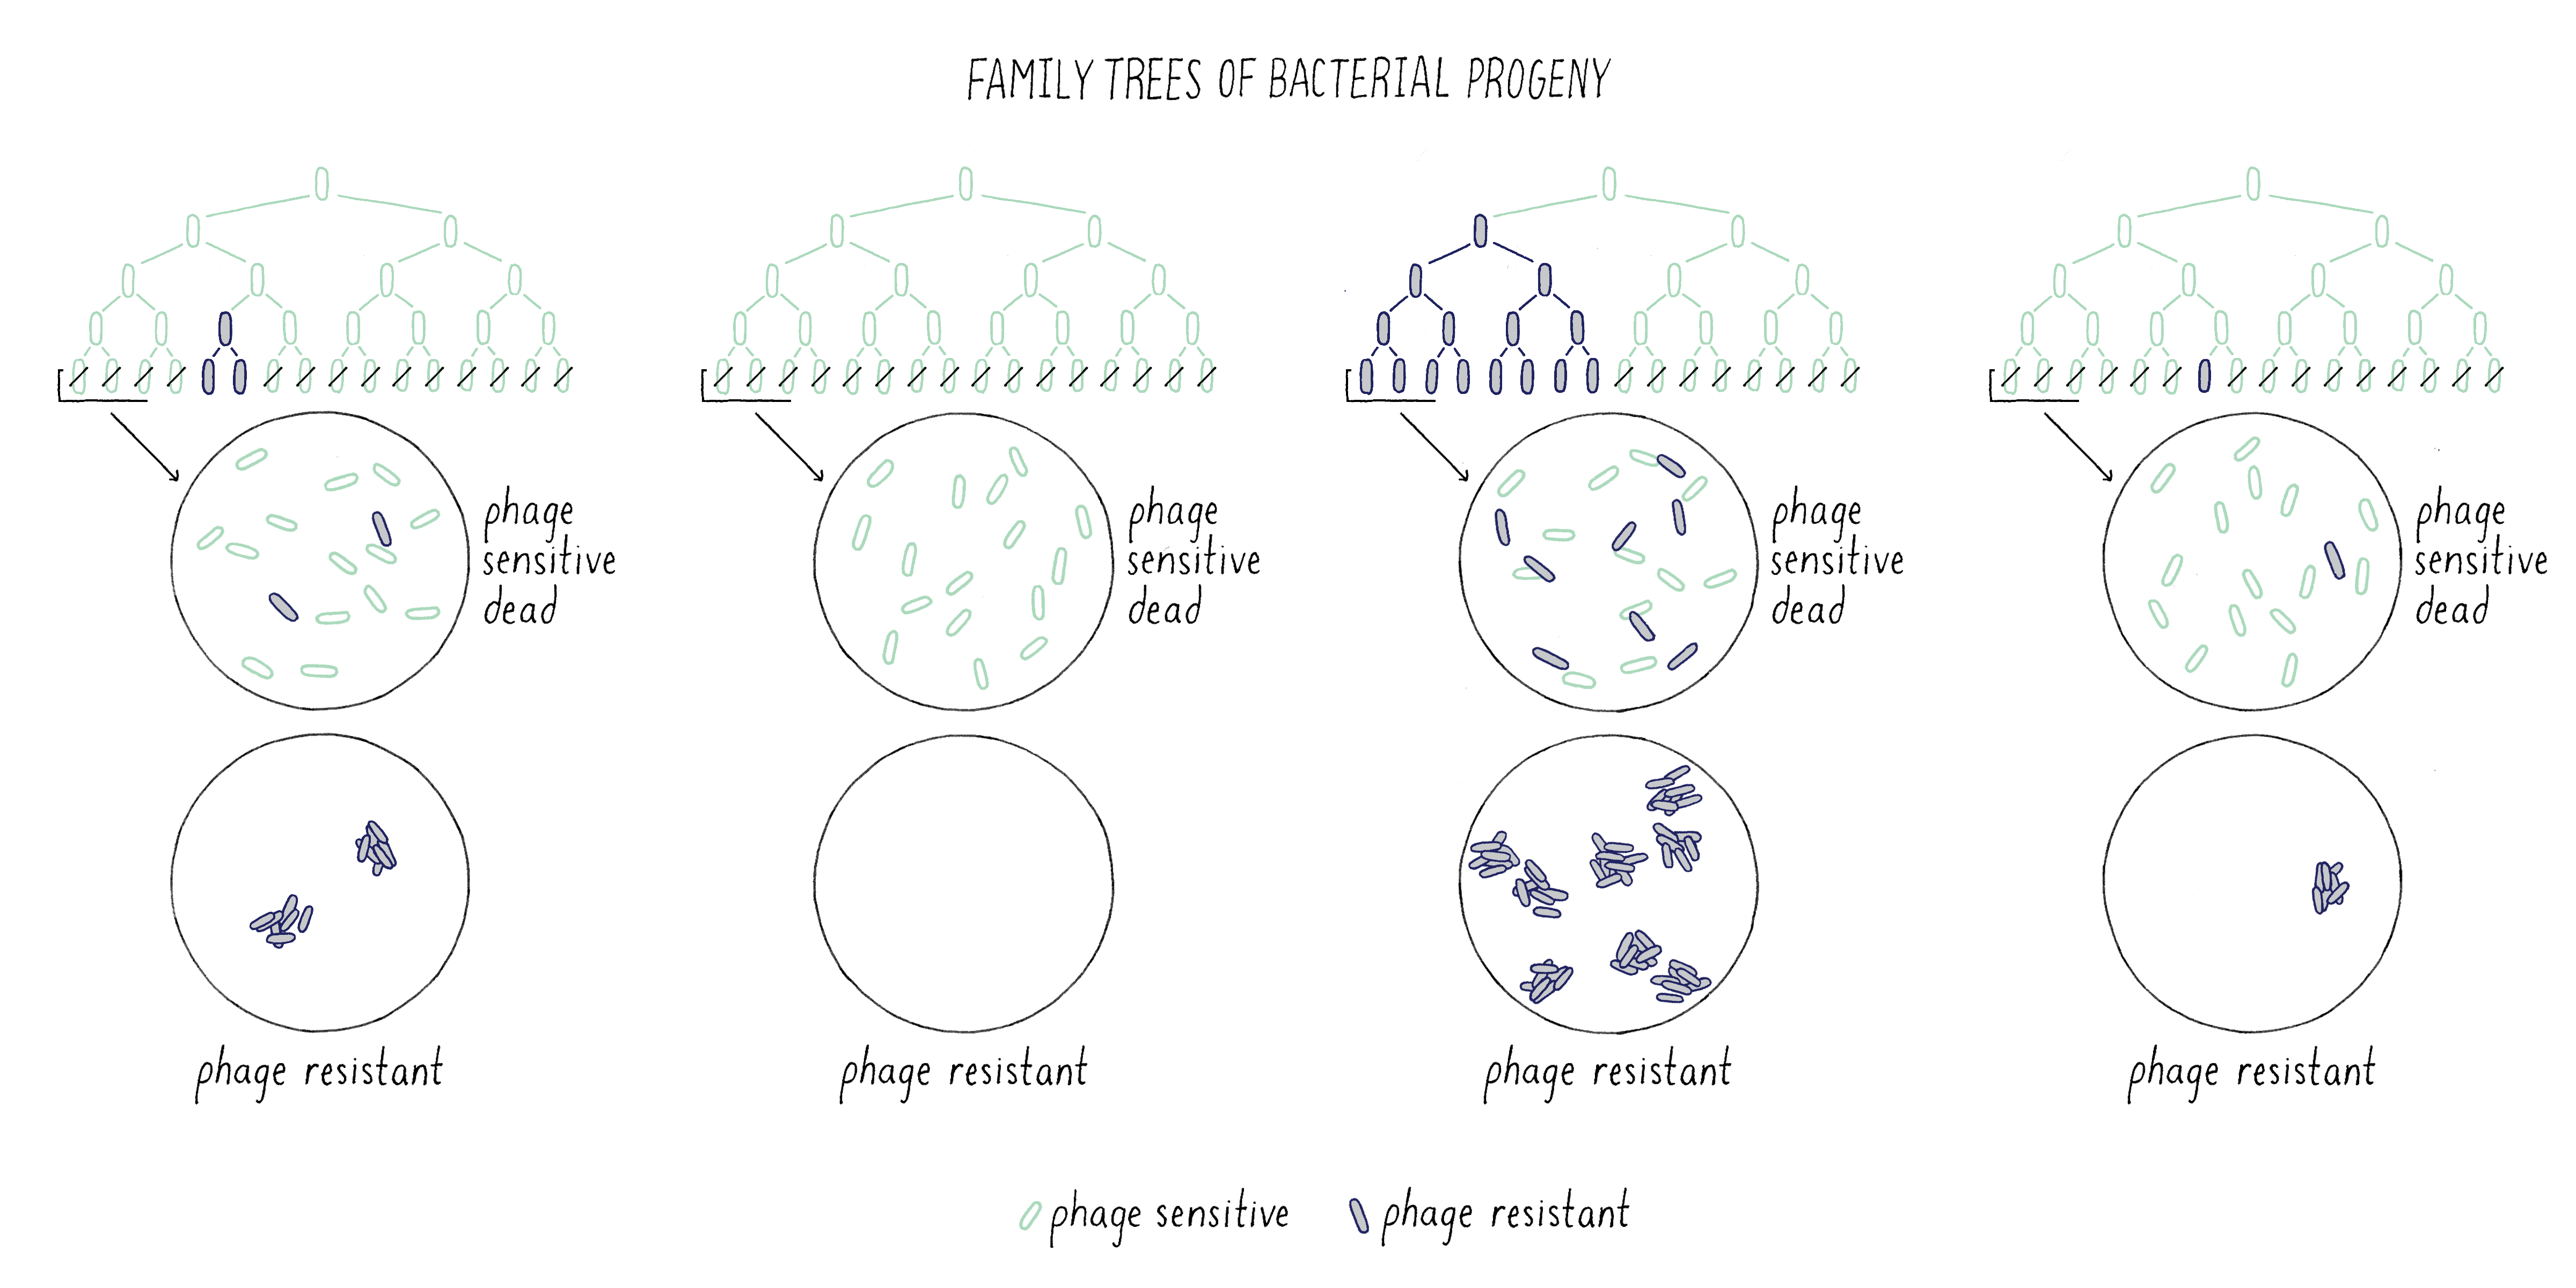
Now consider the Darwinian idea – the Spontaneous Mutation Model (Figure 9). In this case, phage mutations can occur at any time, and not just after plating on the phage. Spontaneous mutations still occur in a random Poisson process, but an important new variable is added to this experiment – time. Starting with one phage-sensitive bacterium, it divides and divides until the culture reaches 1 billion cells, the number of cells that you want to add to your phage plate. As the cells are growing, a mutation can take place that renders a bacterium resistant to phage. If the phage-resistant mutation occurs “early” during the growth of the culture, that lucky bacterium has a chance to divide several times to generate many more phage-resistant descendants. Each of those descendants would survive when plated on the phage plate and grow up to give rise to phage-resistant colonies. For example, a single phage-resistant bacterium that arose in culture and divided 6 times would give rise to 64 phage-resistant colonies on the phage plate. Thanks to cell division, the number of resistant colonies was amplified 64 times compared to if that one mutation occurred after phage plating. Effectively, the “luck” of an early mutation created a “jackpot” of phage-resistant colonies.
Here lies a clear difference in the expected outcome of the Spontaneous Mutation Model from the Induced Mutation Model with regard to the Explorer’s question described above. If one grows up one hundred separate cultures of bacteria, then, if the Spontaneous Mutation Model is correct, the spread of the distribution of phage-resistant colonies would be much greater than that predicted by the Poisson distribution. In particular, one would expect large outliers (which Luria called “fluctuations”) due to mutations that occurred early in the growth process and had a chance to give rise to many progeny (Figure 10).
To help solidify this idea, lets return to the analogy of handing out $1 bills to students in my class. Instead of just receiving the $1, imagine that a student could immediately invest the $1 in a crazy scheme that doubled their money every 20 minutes (which so happens to be the doubling time of E. coli). If it took 2 hours to hand out my money, the student who received the first $1 could have made $64! In contrast, a student whose name was drawn last from the hat would have only $1, and many students would have received nothing at all! Thus, the process of time-dependent amplification produces greater spread in the outcome than predicted by the Poisson distribution (where no student was likely to make even $10)1.
As an additional note, phage-resistant mutations occur to “random” bacteria (similarly to the random lucky student) but also occur randomly in time. In my student analogy, not only would I be drawing student names from the hat at random, but would be doing so with a timer that rang at random intervals.
Results of Luria’s experiment
Excited by his strategy, Luria immediately turned to doing an experiment (described below and in Video 4).
Luria set up lots of bacterial cultures and measured their ability to produce phage-resistant colonies. Three days later, he nervously began counting colonies. Would his strategy give a definitive answer, and if so, what would it be? Would the number of phage-resistant colonies in the cultures follow a Poisson distribution, as predicted by the Induced Mutation Model, or show large fluctuations that deviated from the Poisson distribution, as predicted by the Spontaneous Mutation Model.
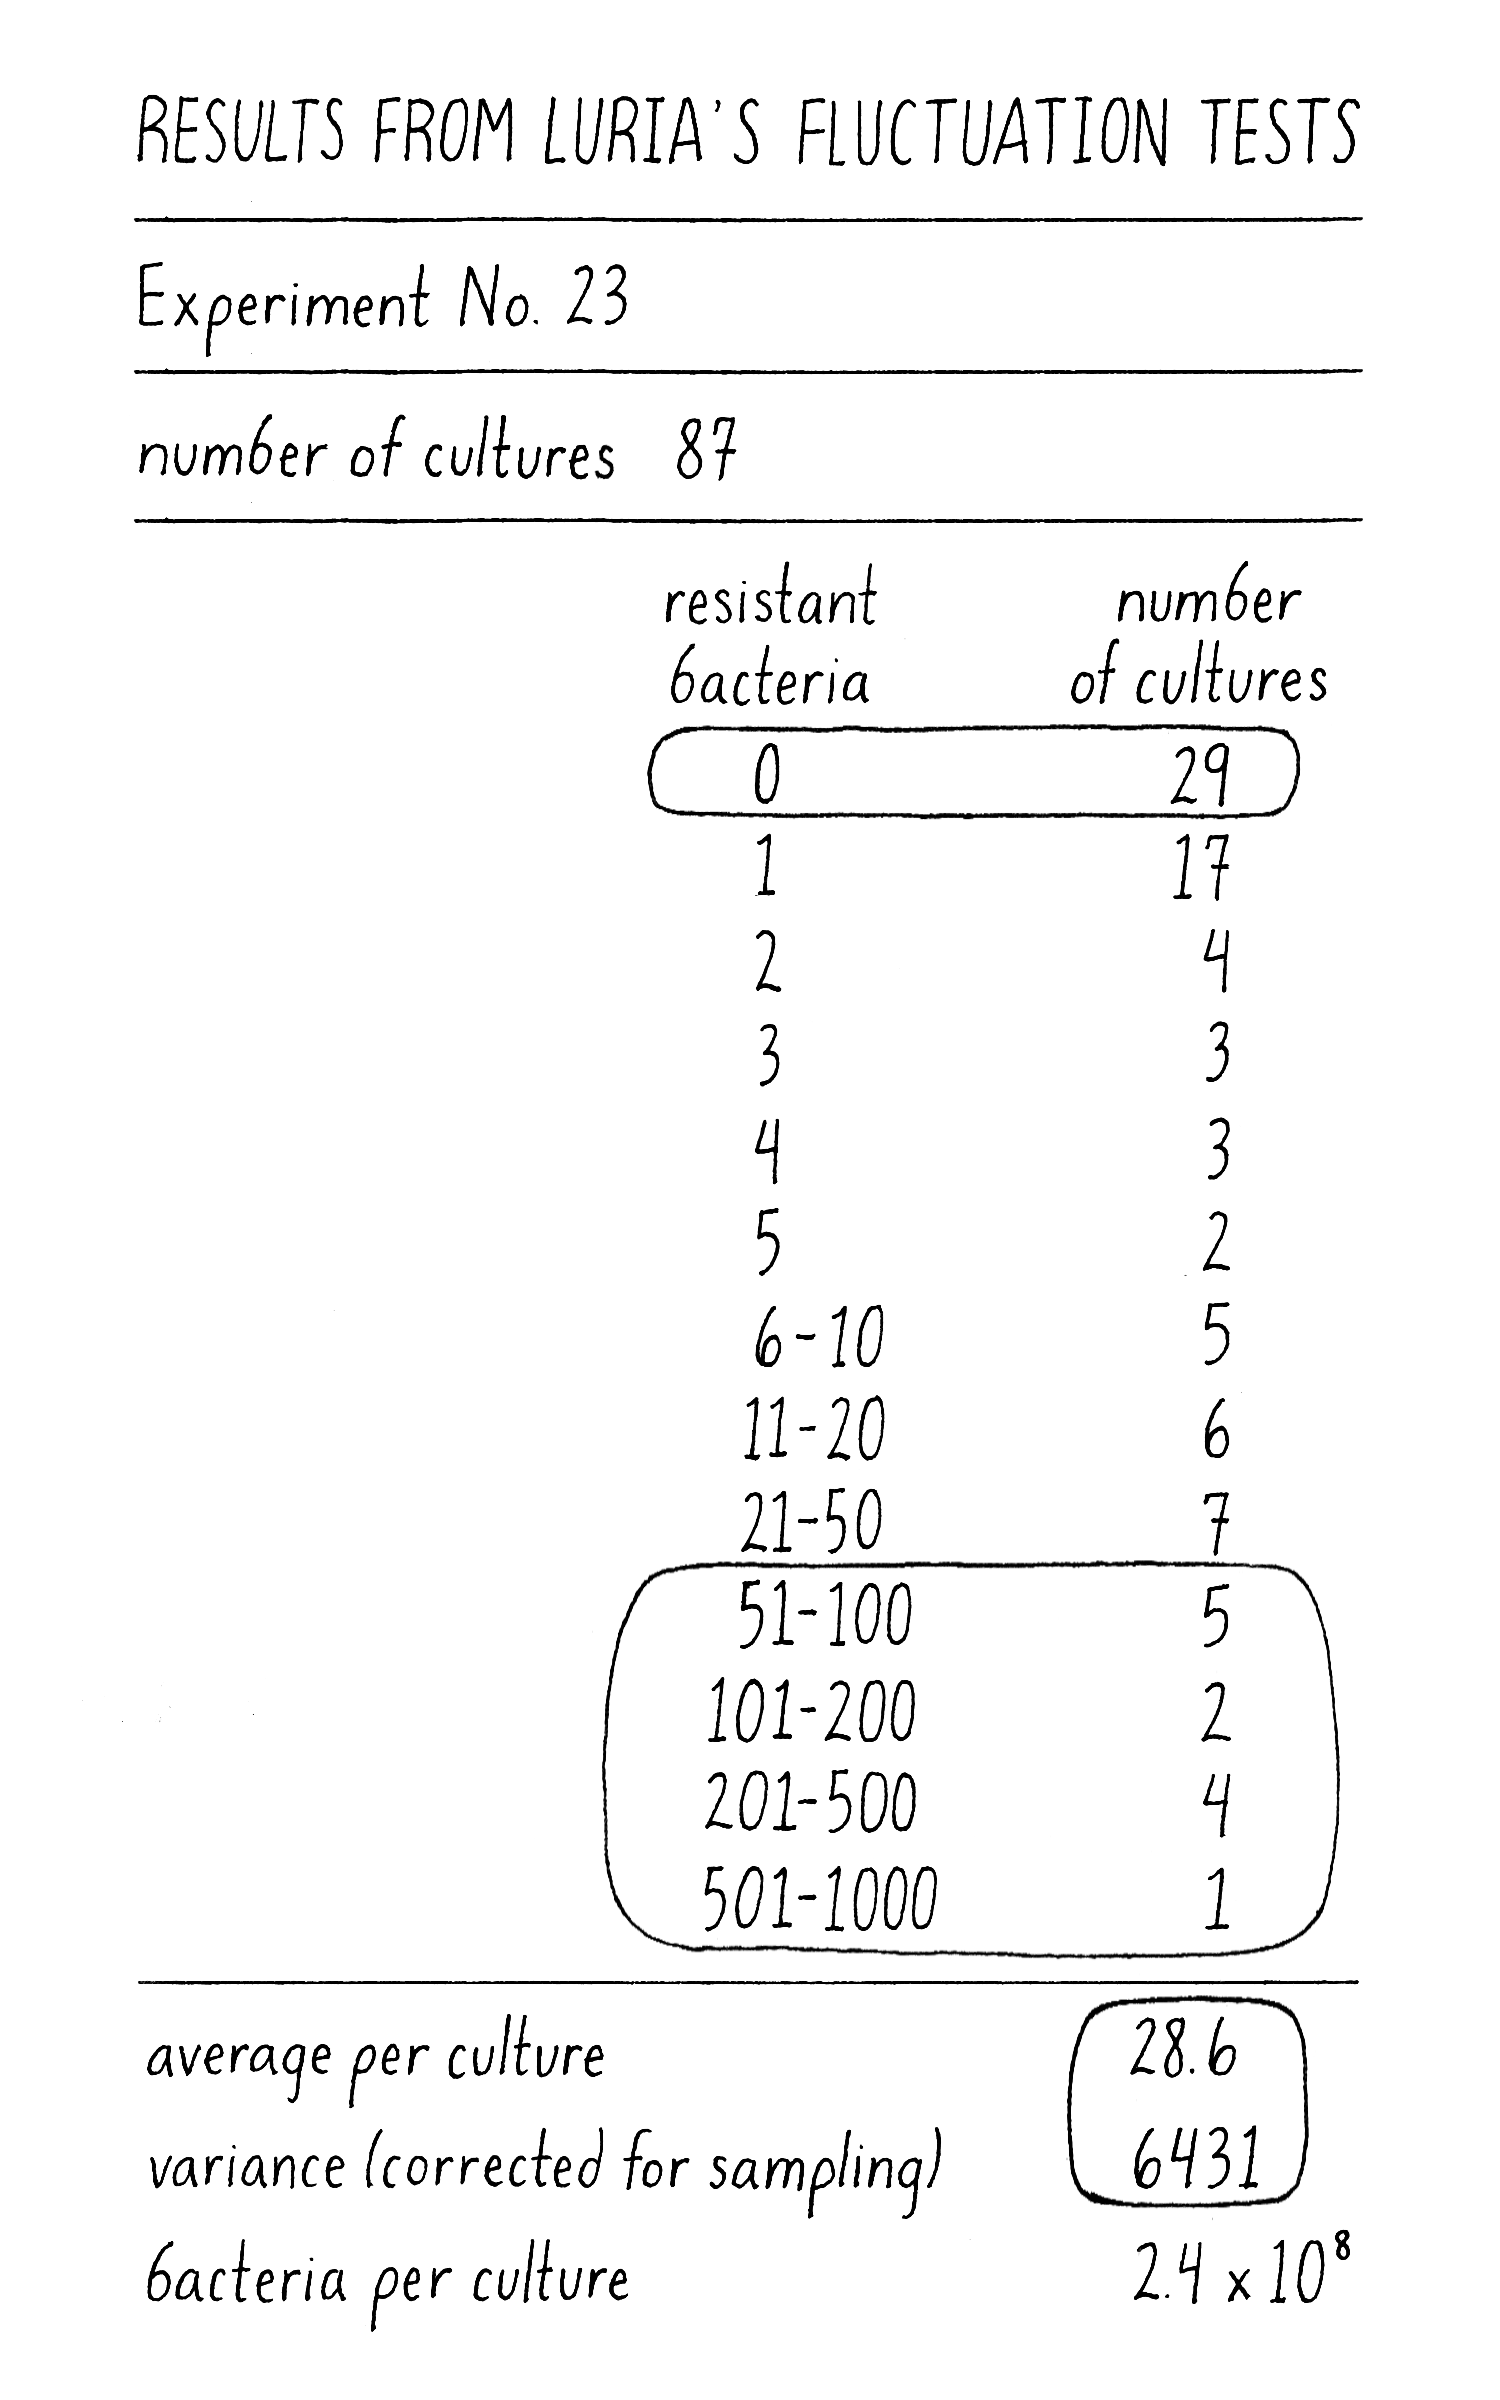
What did Luria see? As an example in one experiment with 87 independently grown cultures, the mean number of phage-resistant colonies per culture was 26. By the Induced Mutation Model, the number of phage-resistant colonies from individual cultures should follow a Poisson distribution with most cultures producing between 14 and 40 phage-resistant colonies (a variance of ~26). Cultures with 0 or >45 phage-resistant colonies should not be observed. However, Luria observed a variance of 6000 due to 29 cultures with 0 resistant colonies and 12 with >50 colonies (Figure 11)! Clearly this distribution looked nothing like a Poisson distribution for a mean of 26. These results of extreme variation and high outliers were inconsistent with the Induced Mutation Model and were as predicted by the Spontaneous Mutation Model. Was it time to celebrate? Could he have been fooled? Luria did another experiment to be sure that his results could be interpreted correctly.
Luria’s control experiment
Luria’s results were potentially exciting, but what if his experimental technique was inaccurate and somehow gave rise to large fluctuations for some artifactual reason? For example, perhaps there were some plates where the phage did not kill all of the sensitive bacteria, giving rise to a large number of colonies? He realized that he needed to do a “Control Experiment” to rule out this possibility. You will hear a lot about control experiments in The Explorer’s Guide to Biology. They are the meat and potatoes of being a scientist. Scientists are constantly confronted by colleagues with the tough but good question, “Did you do a control for….” The goal of a control experiment is to determine whether an observed difference is the consequence of the intended variable (differences between cultures) rather some unanticipated variable (differences between phage plates) that would greatly alter the interpretation.
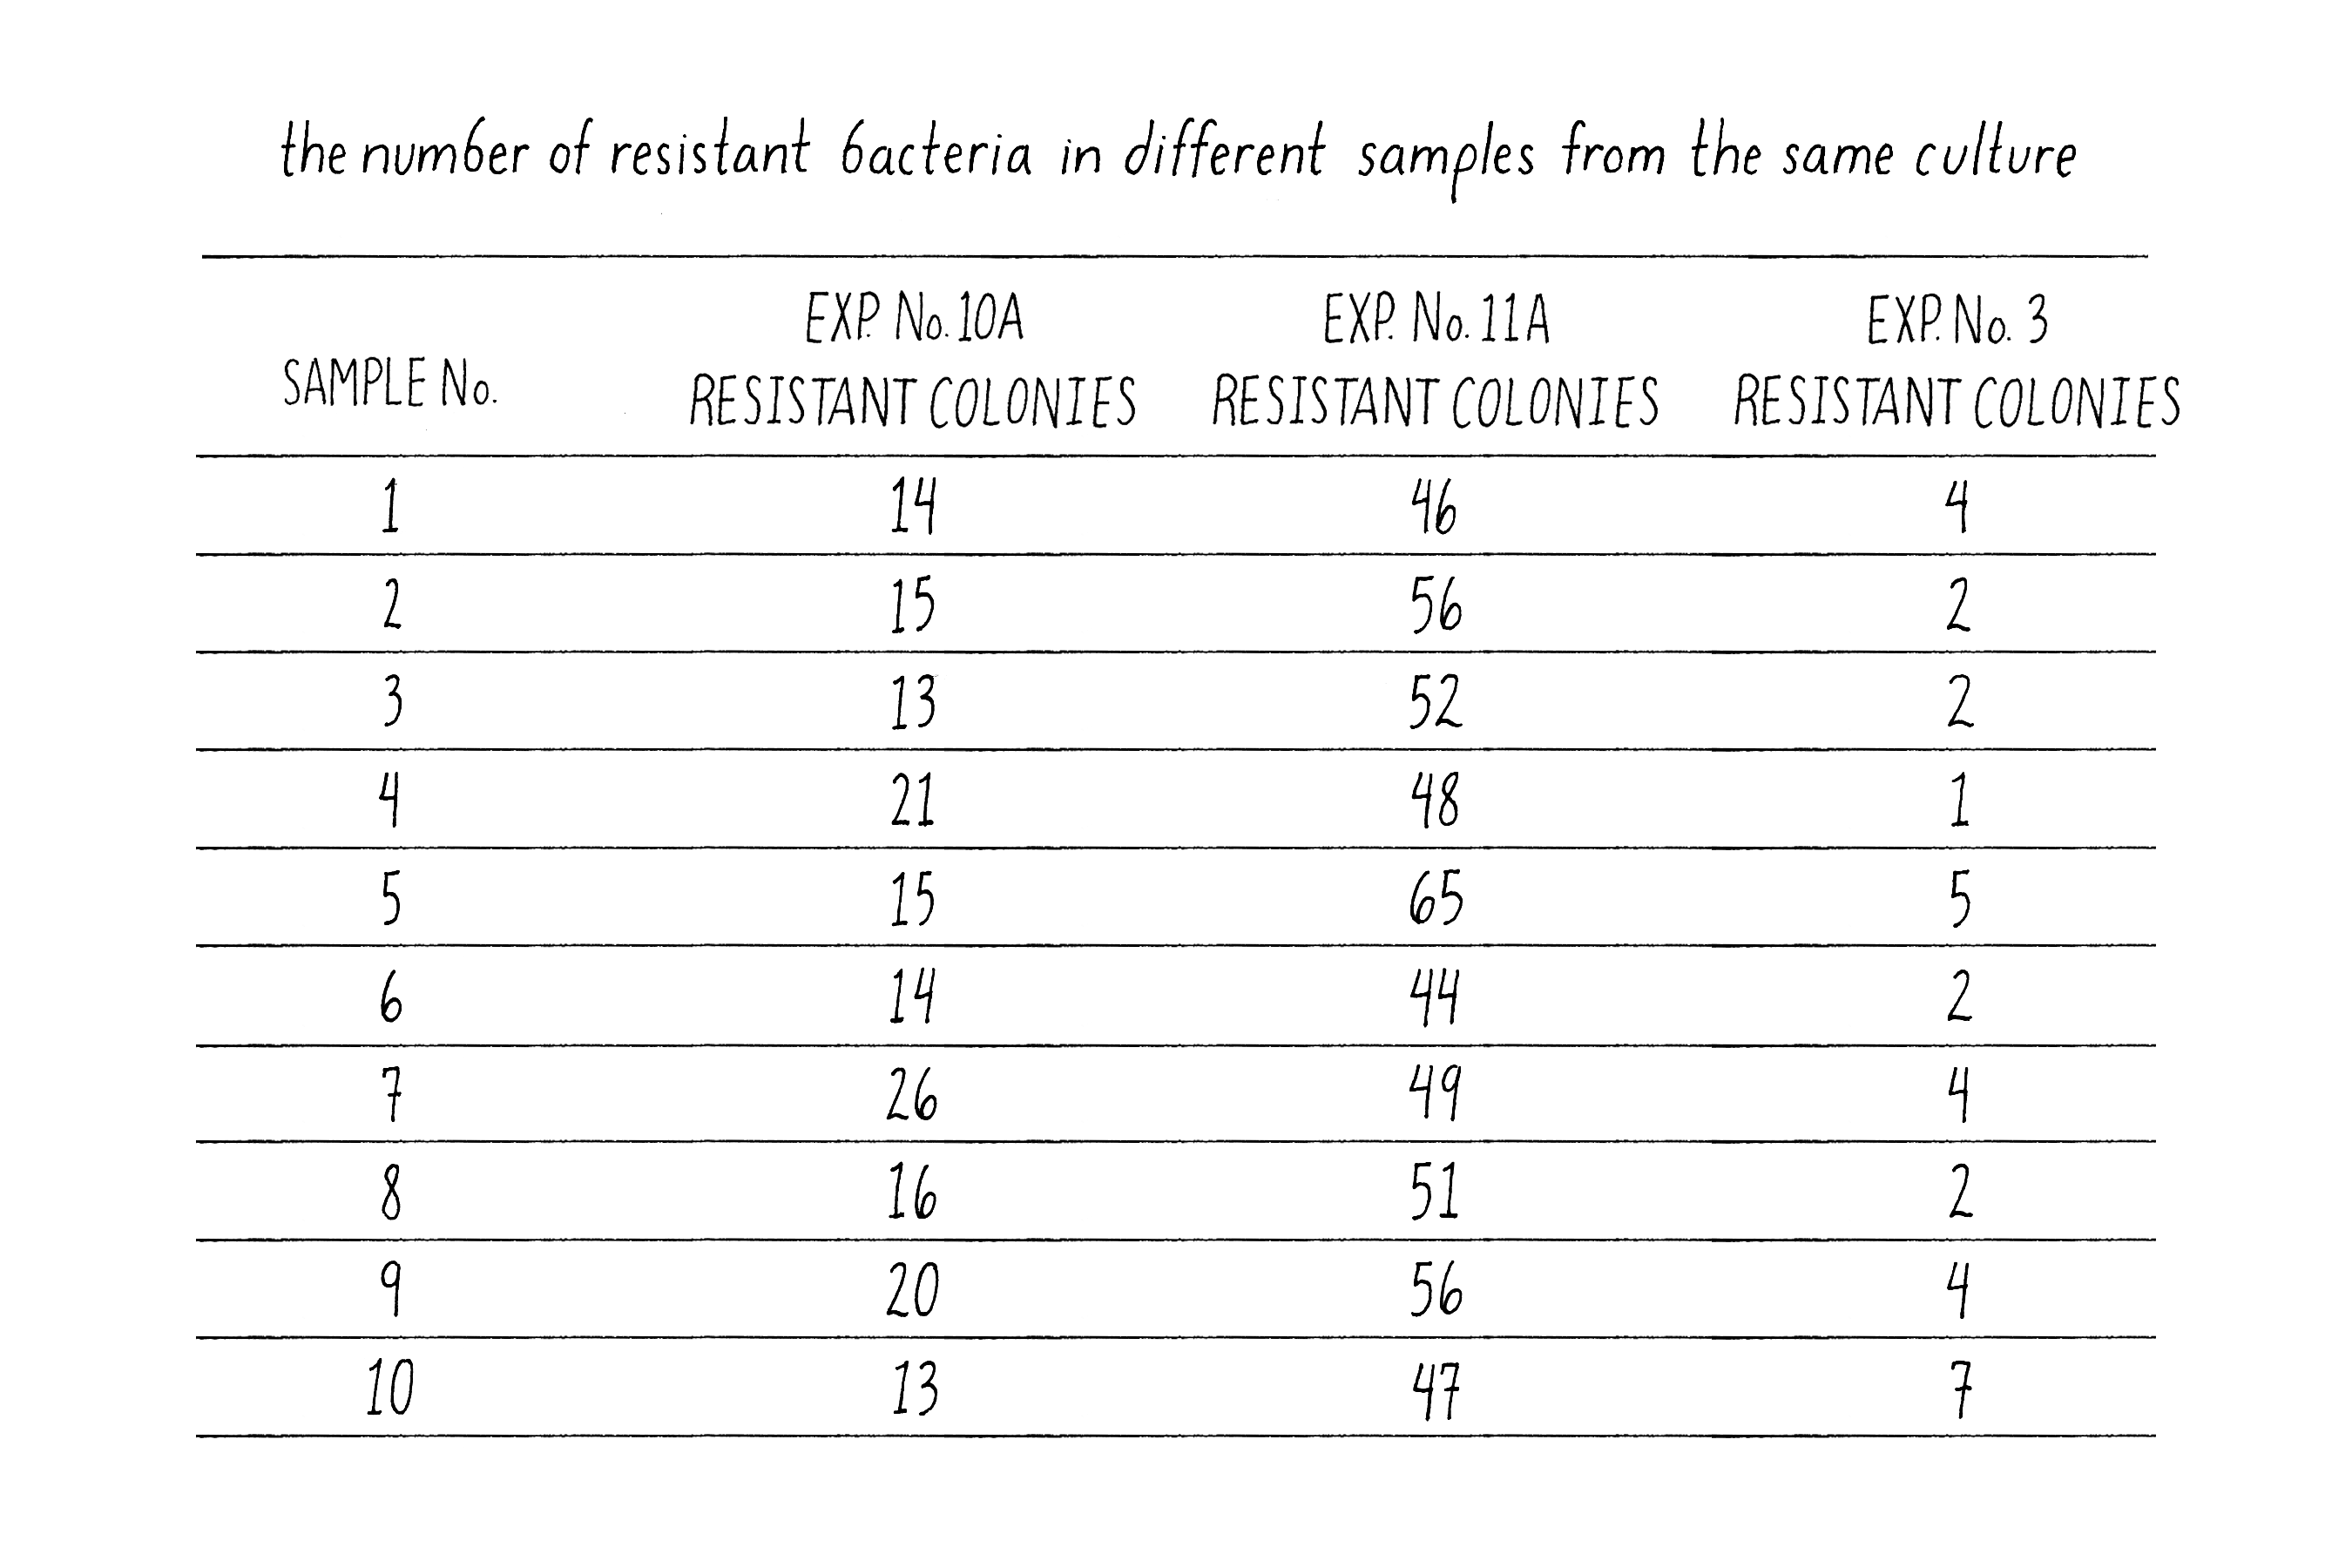
In Luria’s control experiment, he examined the formation of phage-resistant colonies from 10 samples (10 phage plates) from three different cultures grown from separate bacteria (Figure 12). The numbers of phage-resistant bacteria in samples from different cultures might vary because the number of phage-resistant cells would depend upon the particular history of that culture, as Luria found and as predicted by the Spontaneous Mutation Model. However, the number of T1-resistant colonies from 10 samples taken from the same culture should be very similar, because all ten samples had the same history. Indeed, this was exactly the case – the number of phage-resistant colonies from the same culture was much more similar than from different cultures. Luria had convinced himself that the large variations that he observed in the numbers of phage-resistant colonies between cultures were not due to some trivial error of the experimental design but reflected the biology of the bacteria.
Explorer’s question: Should you do the control experiment before, on the same day, or after the “real” experiment?
Answer: The description above presents the experiment and then the control for teaching purposes. As a general rule, it is always best to perform controls on the same day as your experiment since then know that everything (your media, your phage plates, temperature, etc.) is the same. This is what Luria did. He knew that he could interpret the answer immediately.
In summary, here is what Luria had to say about his 3-day Nobel Prize winning experiment, including his simultaneous controls that were important enough to deserve equal mention:
“I set up the experimental test of my idea – several series of identical cultures of bacteria, each starting with very few bacteria. It was a hard Sunday to live through, waiting for my cultures to grow…. Next day, Monday morning, each culture contained almost exactly one billion bacteria….I proceed to mix each culture with phage on a single test plate. Then I had a day waiting….Tuesday was the day of triumph. I found an average of ten resistant colonies per culture, with lots of zeros and, as I had hope to find, several jackpots. I had also set up my controls…. Complete success: this time the average number of resistant colonies was about the same, but the individual numbers were distributed at random and there were not jackpots.”
Max Delbruck and the power of math in understanding biology
If this Spontaneous Mutation Model was correct, it should be possible to write a mathematical equation that predicts quantitatively the distribution of phage-resistant colonies in the cultures by elaborating the Poisson process with additional terms that take into account the time component for the formation of mutations. For this advanced math, Luria needed help. He turned to his friend Max Delbrück who was an even better mathematician (Delbrück also appears in the Narrative by Vale on DNA Structure, and in the Key Experiment by Meselson and Stahl on DNA Replication). A common misperception of research is that it is a vicious competition among scientists to make THE discovery. In fact, research is extremely collegial. Scientists are bonded by their hyper curiosity, their appreciation of success, and their commiseration during all too common failures. Indeed by incorporating new terms, Delbrück was successful at deriving a complex formula that predicted quite accurately the distribution of T1 resistant colonies in individual cultures that Luria observed. The fit of Delbrück’s equation to the data further validated the conclusion that new traits arose through spontaneous mutations.
Demonstrating that new traits arose from spontaneous mutations was a huge discovery. However, Luria and Delbrück went one step further and determined the rate of formation of spontaneous mutations to phage resistance per cell division. This might seem like a boring detail but, in fact, this quantitative measurement provided profound insights into evolution and treatment of disease.
The spontaneous mutation rate to phage resistance can be calculated from the following division:
=mean number of spontaneous mutations to T1 resistance/number of cell divisions
The final number of cells in a culture is a very good approximation of the number of cell divisions (see Dig Deeper 3). The mean number of spontaneous mutations in a culture could be calculated from Luria’s results and the Poisson equation. Cultures that failed to produce phage-resistant colonies must have had zero spontaneous mutations to phage resistance. This fraction was a direct measure of the underlying Poisson distribution for the formation of spontaneous mutations to phage resistance because it could not be distorted by the multiplication of descendants. Luria observed zero resistant colonies in 27 out of 87 cultures, so P(0), the probability of getting zero initial phage-resistant colonies/mutations in a culture, was 0.33. Plugging this value into the Poisson equation, 0.33 = e-mm0/0! Solving this equation for m, the mean number of initial phage-resistant cells in the cultures, gives 1.1. Dividing this mean by the average final number of cells in the culture gave a value of 0.32 × 10⁻⁸ spontaneous mutations to phage resistance per cell division. Luria and Delbrück had not only provided compelling proof for the spontaneous mutation model, but they also measured the rate of spontaneous mutation for the first time in any organism.
Had Luria performed his experiment today, he might have sought out a physical biologist, like Hernan Garcia who developed the Activity associated with this Narrative in which you can test Luria’s conclusions yourself through simulations. Try it! See the results appear in real time and experience how Luria must have felt while counting his colonies during his Nobel Prize experiment! Explore how mutation rate and sample size affect the outcome of the experiment.
What Happened Next?
Validation of spontaneous mutations using another approach
Luria and Delbrück’s paper was greeted with great excitement, as it provided the first convincing evidence that new traits originated by spontaneous mutations. However, some scientists remained skeptical because they were uncomfortable with this novel mathematical methodology. Wariness is a common and useful feature of the research community. The best way to convince skeptics is through a different approach that emerges with the same answer.
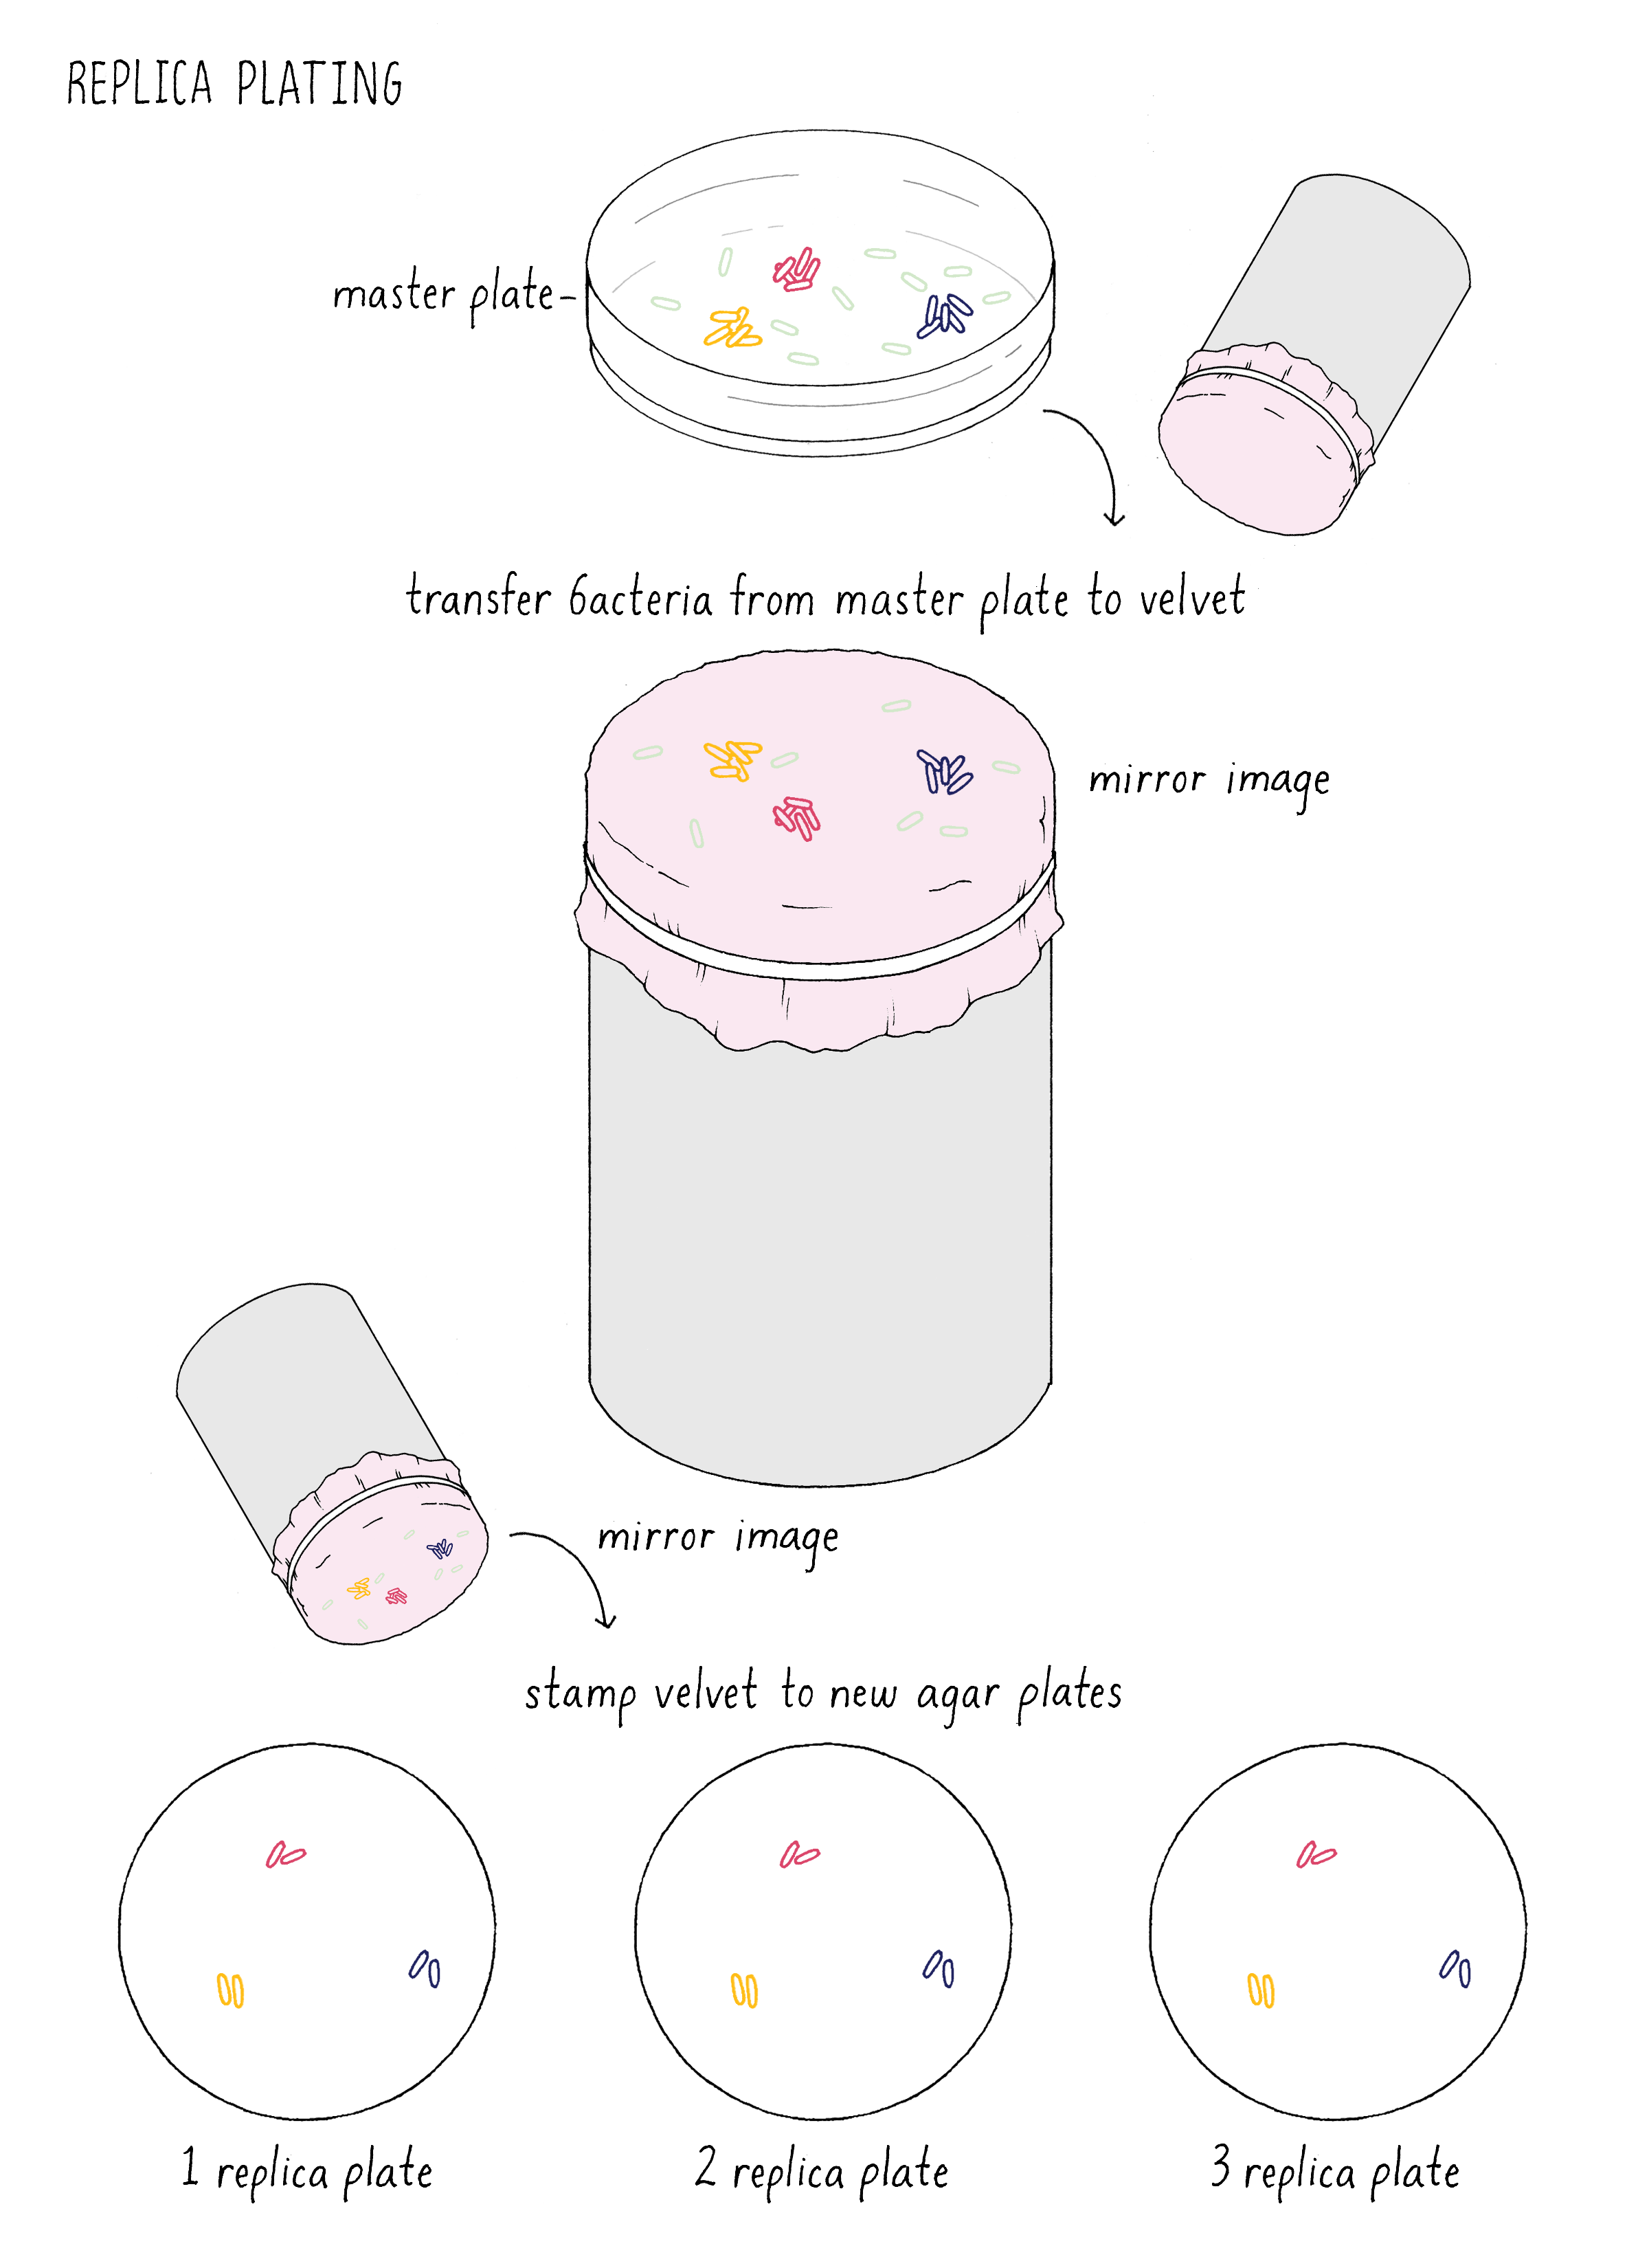
Inspired by Luria and Delbrück, Joshua Lederberg tested the spontaneous mutation model without mathematics using a new technique he invented called “replica plating” (Figure 13). This method mimics a printing press in the following manner. Imagine putting a million bacteria on a plate. These cells will divide to generate 1000 descendants (mini colonies) before they use up all the nutrients on the plate. This master plate is pressed against a circular piece of velvet, which adsorbs some of the bacteria, maintaining their spatial relationship to the original plate. This velvet circle is then pressed against a fresh agar plate, transferring some of the bacteria to the new plate. This “printing” of bacteria is inefficient, such that some of the descendants are left behind on the velvet. The velvet then can be pressed against a second or third fresh plate, transferring more bacteria (like a single dab of ink on the press can generate multiple copies).
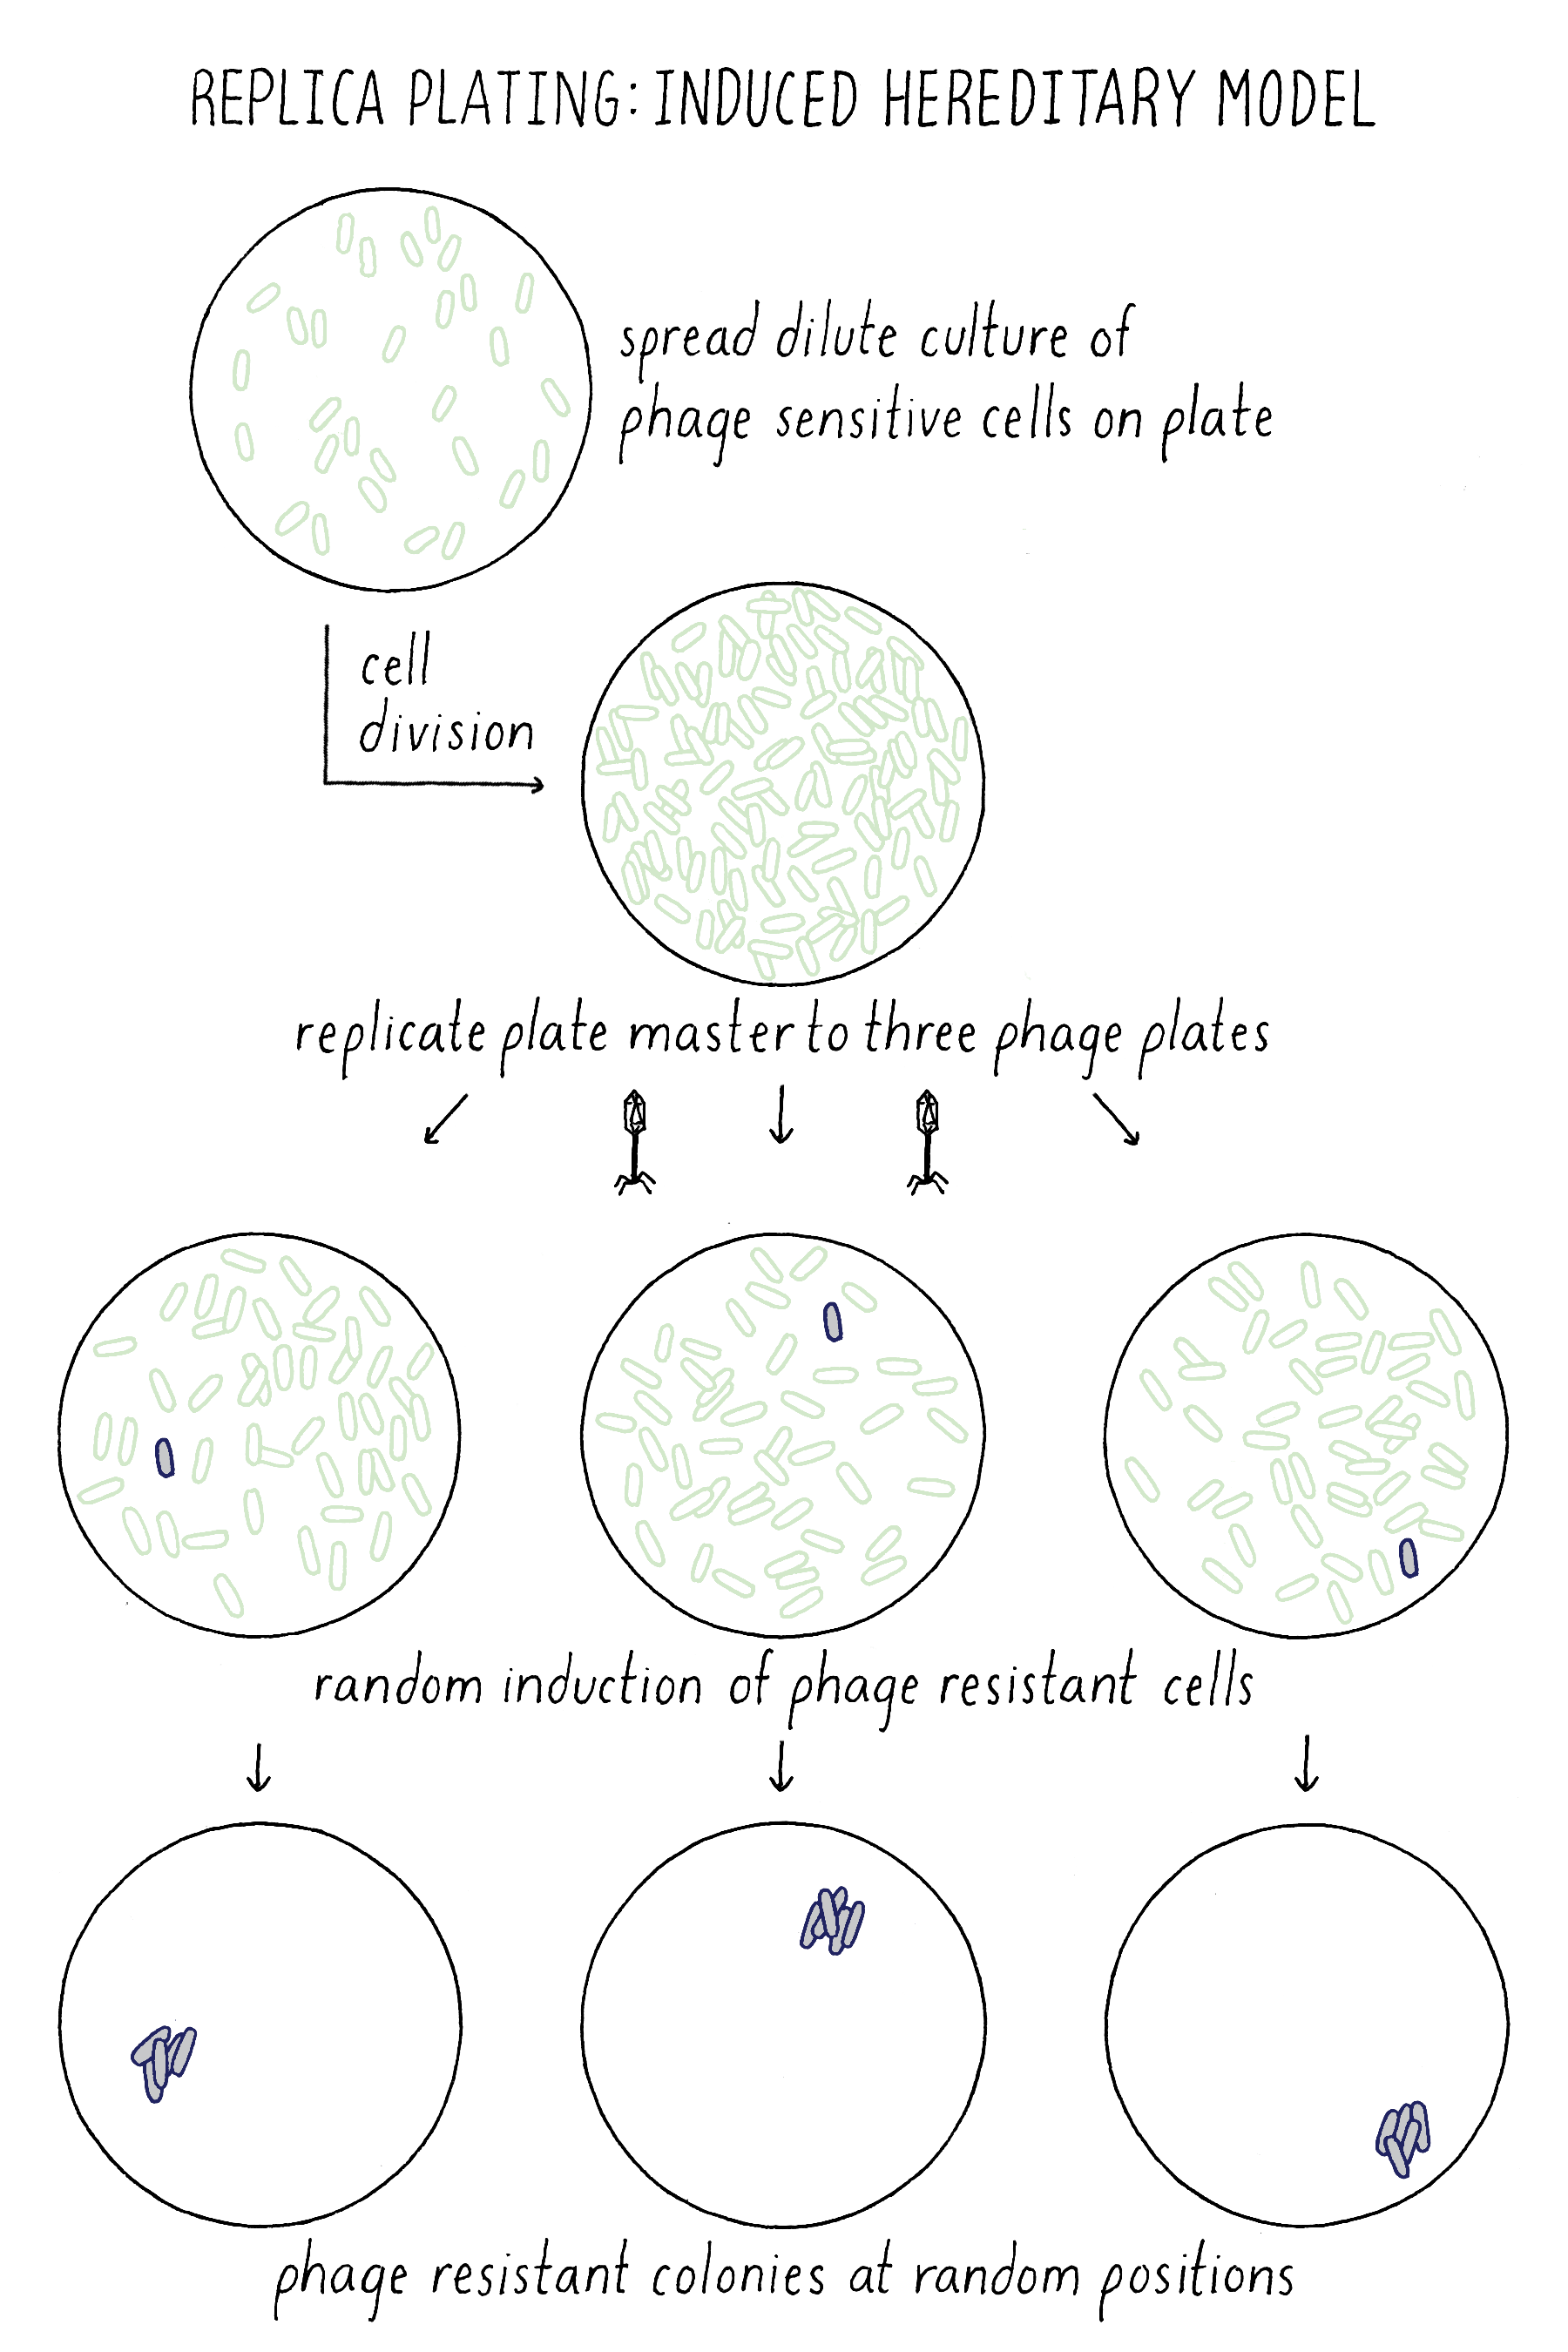
How did Lederberg use this simple technique to test between the Induced Heredity and Spontaneous Mutation Models? Imagine that the million cells on the master plate are all phage-sensitive. In the Induced Mutation Model, all of the initial million cells and their descendants on the master plates would be phage-sensitive. When phage-sensitive cells from this plate were replica plated to the phage plates, the exposure to phage would induce resistance in random cells on each plate. As a result, phage-resistant colonies would form at different position on every replica plate (Figure 14).
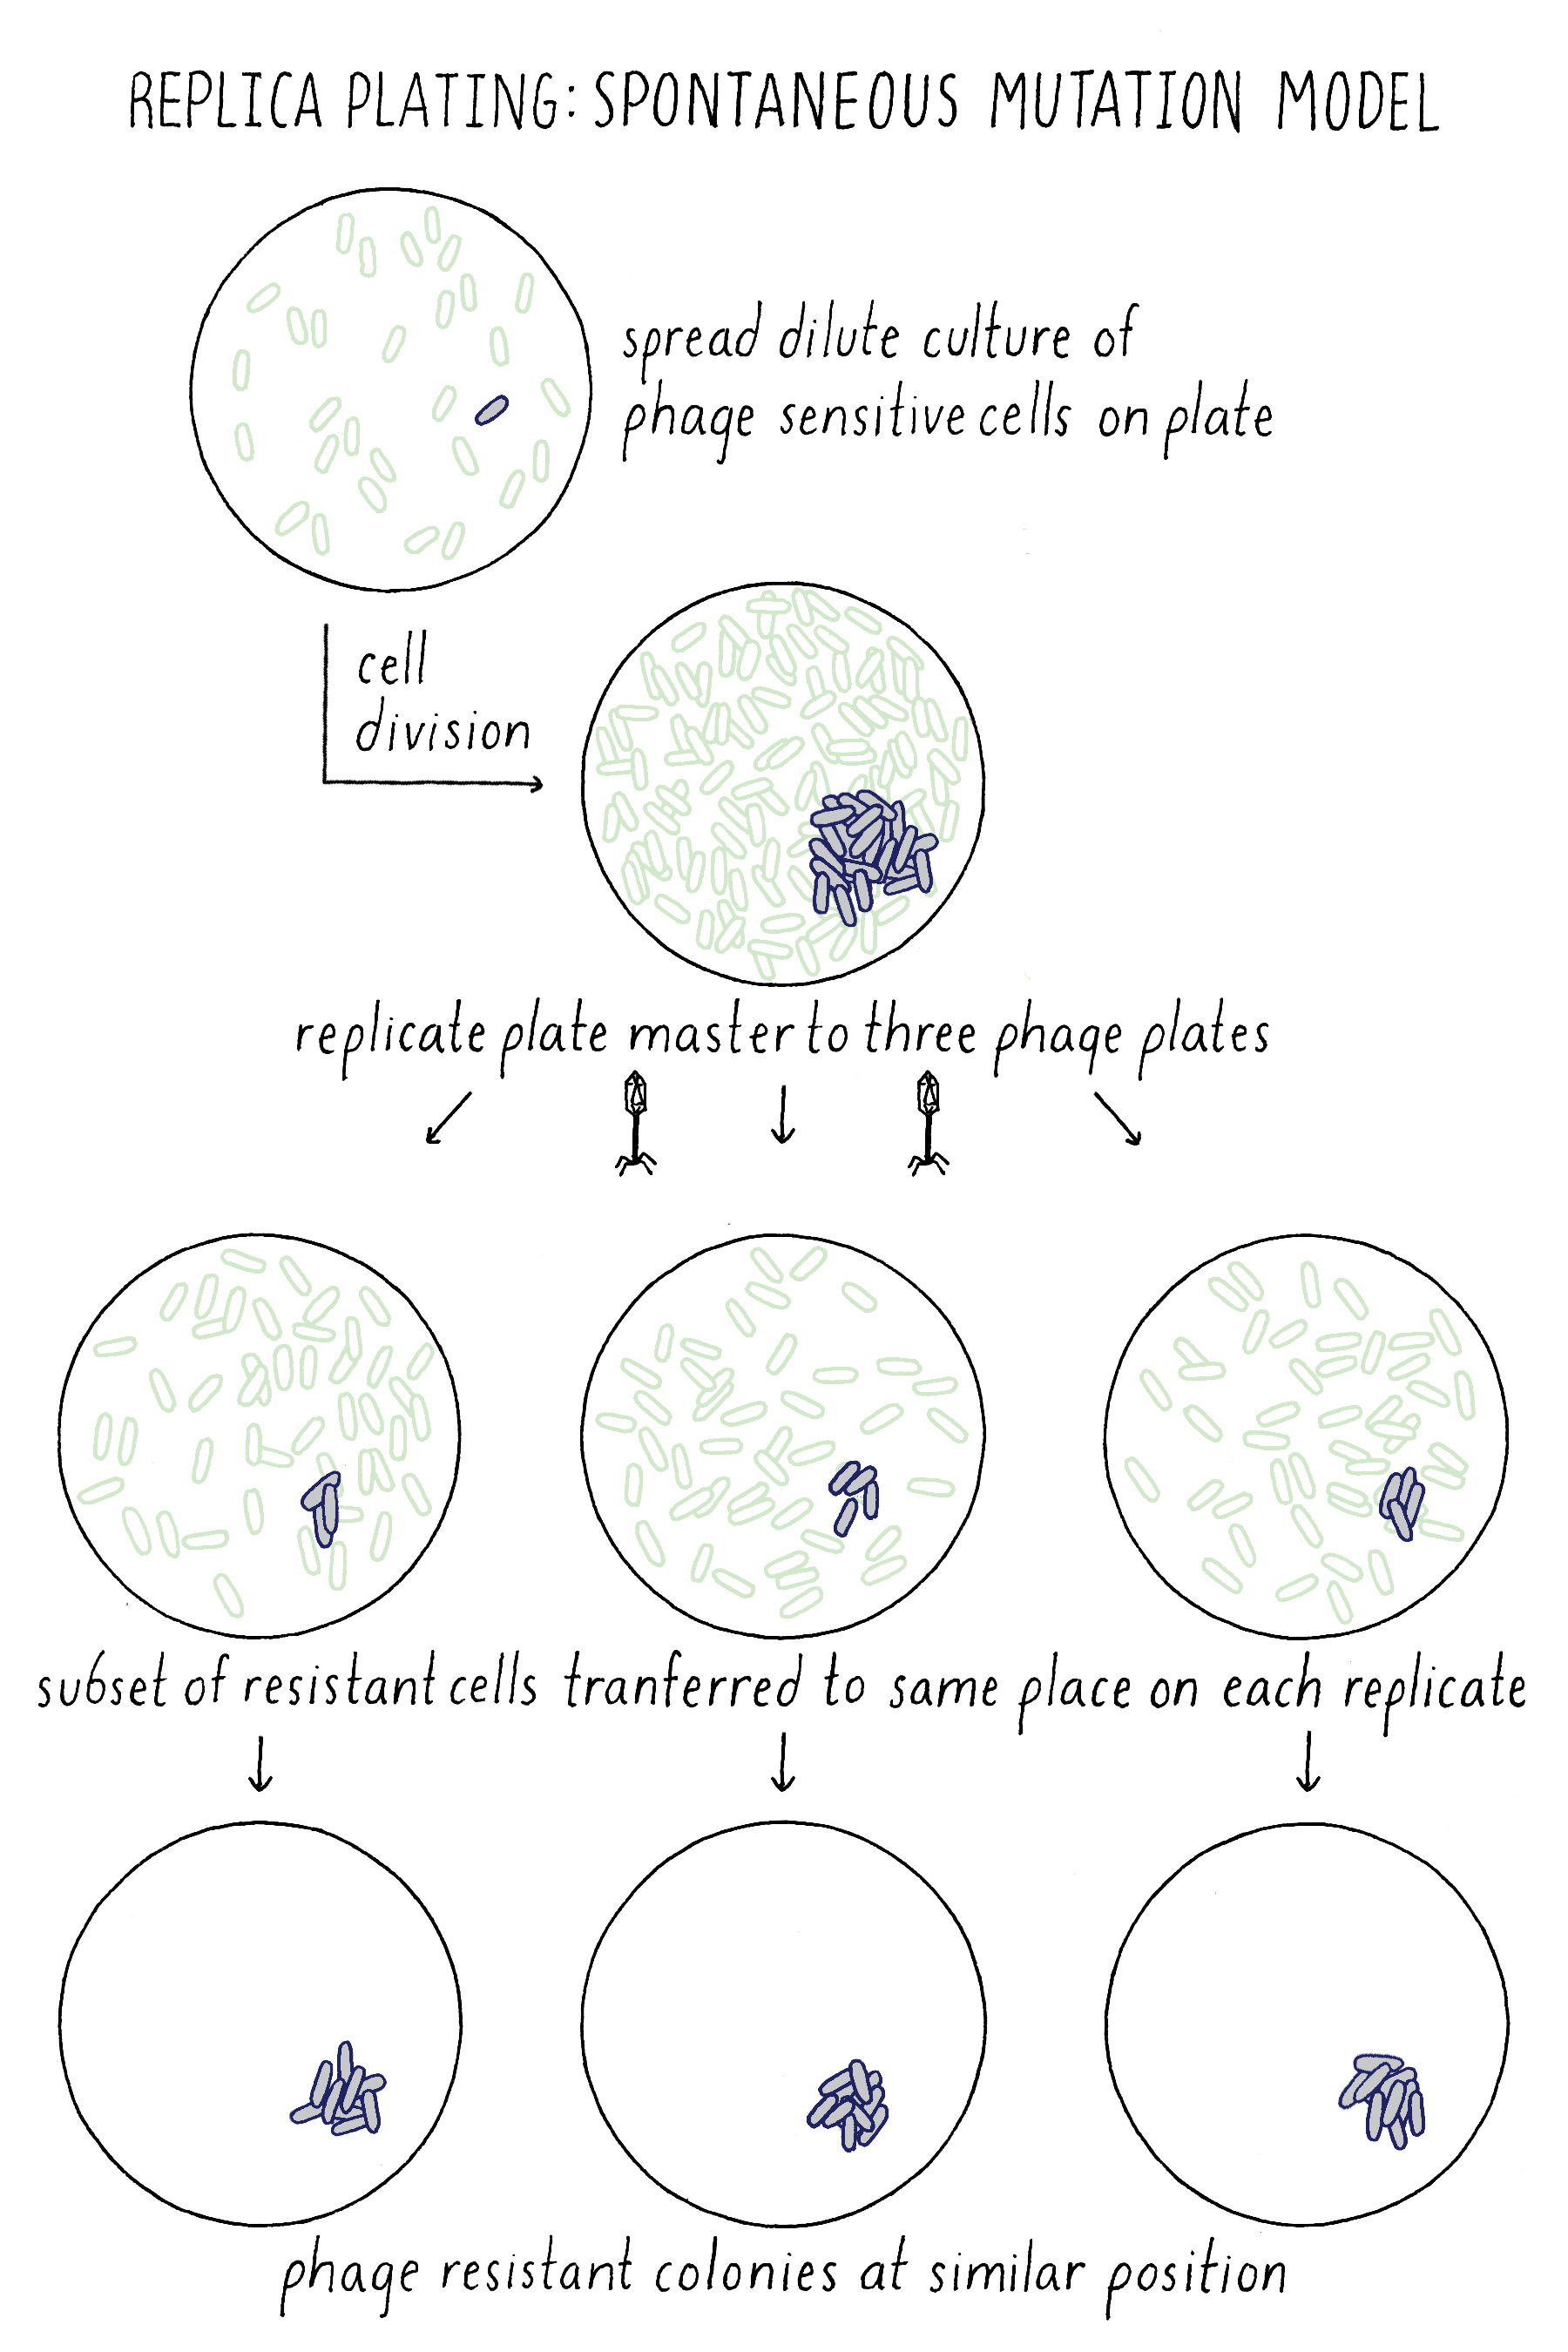
In the Spontaneous Mutation Model, the mutation would occur on the master plate and if early enough, would generate a mini-colony of resistant descendants. Upon replica plating, some of the resistant descendants would be transferred to each plate at exactly the same position, generating resistant colonies at the identical corresponding position on each plate (Figure 15). Indeed, Lederberg observed phage-resistant colonies at the same position on multiple plates, confirming that phage resistance mutations must have occurred spontaneously on the master plate prior to any exposure to phage. He and others used this method to show that other traits besides phage resistance also resulted from spontaneous mutations prior to exposure to any change in their environment, thus showing that the principle of spontaneous mutation is universal and not a special case for phage resistance.
The Lederberg replica-plating experiment is also discussed in Video 5.
Bacteria and viruses: Model systems for studying general principles of life
The Luria and Delbrück paper inspired other studies that quickly showed many features of bacterial inheritance resembled inheritance in plants and animals. With this realization, many scientists turned to bacteria and viruses to solve the most fundamental mysteries of genes: what were they made of, how did they encode information, and how was this information used to make new cells and organisms?
What features of bacteria and viruses made bacteria the model of choice for these scientists? Clearly evident from what I have told you, Luria could get billions of bacterial offspring and nobody cared if he killed them. Since bacteria divide every 20 minutes, it took Luria only 48 hours to generate and collect his data for these critical experiments. Furthermore, he could grow a billion bacteria in a small flask or plate with food that cost only fifty cents. The features of bacteria (easy growth conditions, rapid cell divisions, easy manipulation, and absence of ethical concerns) allowed speedy, large-scale, biochemical, and genetic studies that were impossible in any other system. Imagine the cost, time, ethical concerns, and spatial requirements to grow a billion individuals of corn, flies, or mice – the other models at the time. The subsequent studies of bacteria and viruses led to an explosion of seminal discoveries on the structure and function of proteins and nucleic acids. For a specific example of how Luria and Delbrück’s work impacted future scientists see this iBiology talk by Bob Horvitz regarding his work on programmed cell death. The 1943 experiment of Luria and Delbrück had inspired the birth of molecular biology. It is no surprise that they won the Nobel Prize.
Part II: Knowledge Overview —
The Physical Nature of Mutations
The Different Types of Mutations
The spontaneous mutations identified by Luria and Delbrück remained as undefined changes in an organism’s genetic material. The discovery of DNA as the genetic material occurred later (the first important experiment was published a year after the Luria and Delbrück paper in 1944; see Whiteboard video of the Avery, McCarty, MacLeod experiment). If you need to learn about the basics of DNA and genes, please watch this Whiteboard video on Keeping track of your DNA.
DNA sequencing methods in the 1970s allowed scientists to determine the physical basis of mutations, that is the precise changes that take place in the DNA sequence. Five types of mutations were revealed:
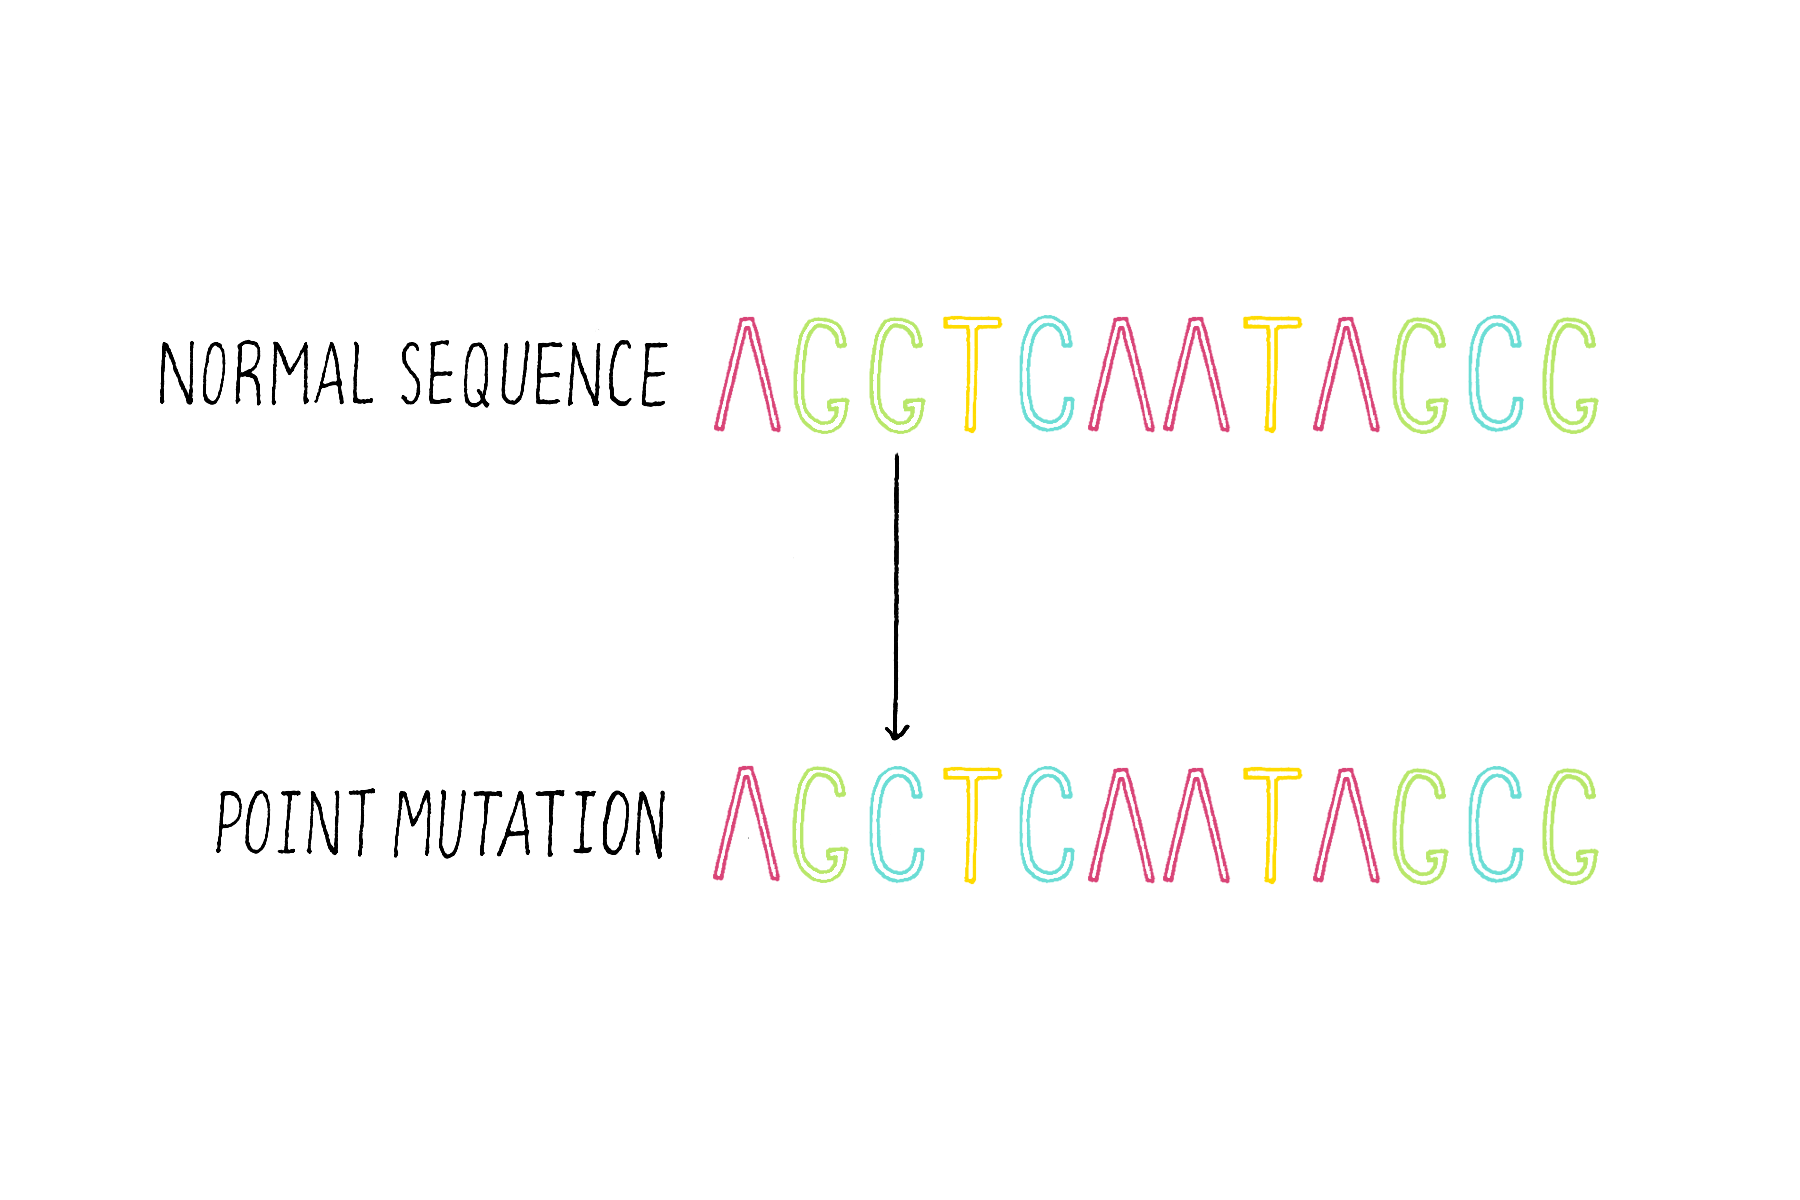
1) Single base substitutions – the change of a base to another base (Figure 16).
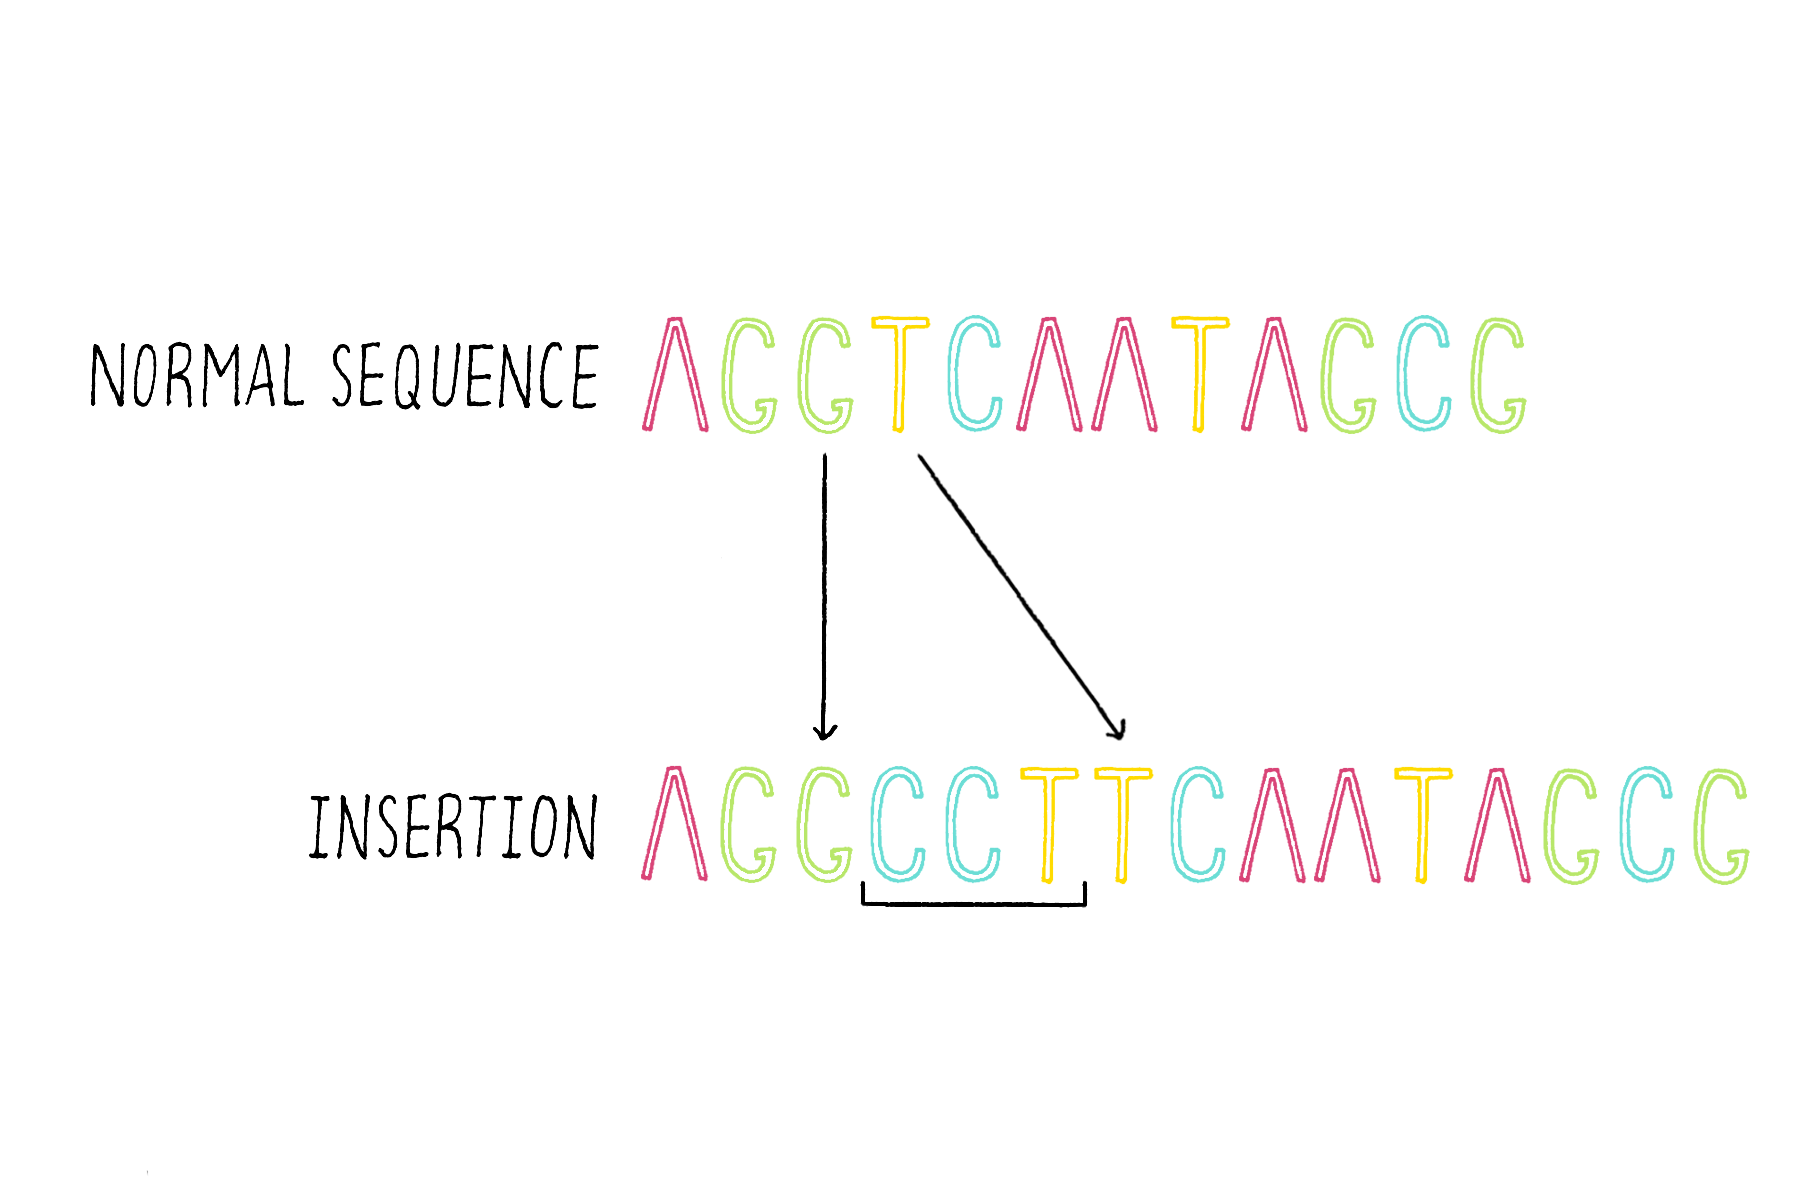
2) Insertions – the addition of one or more bases (Figure 17).
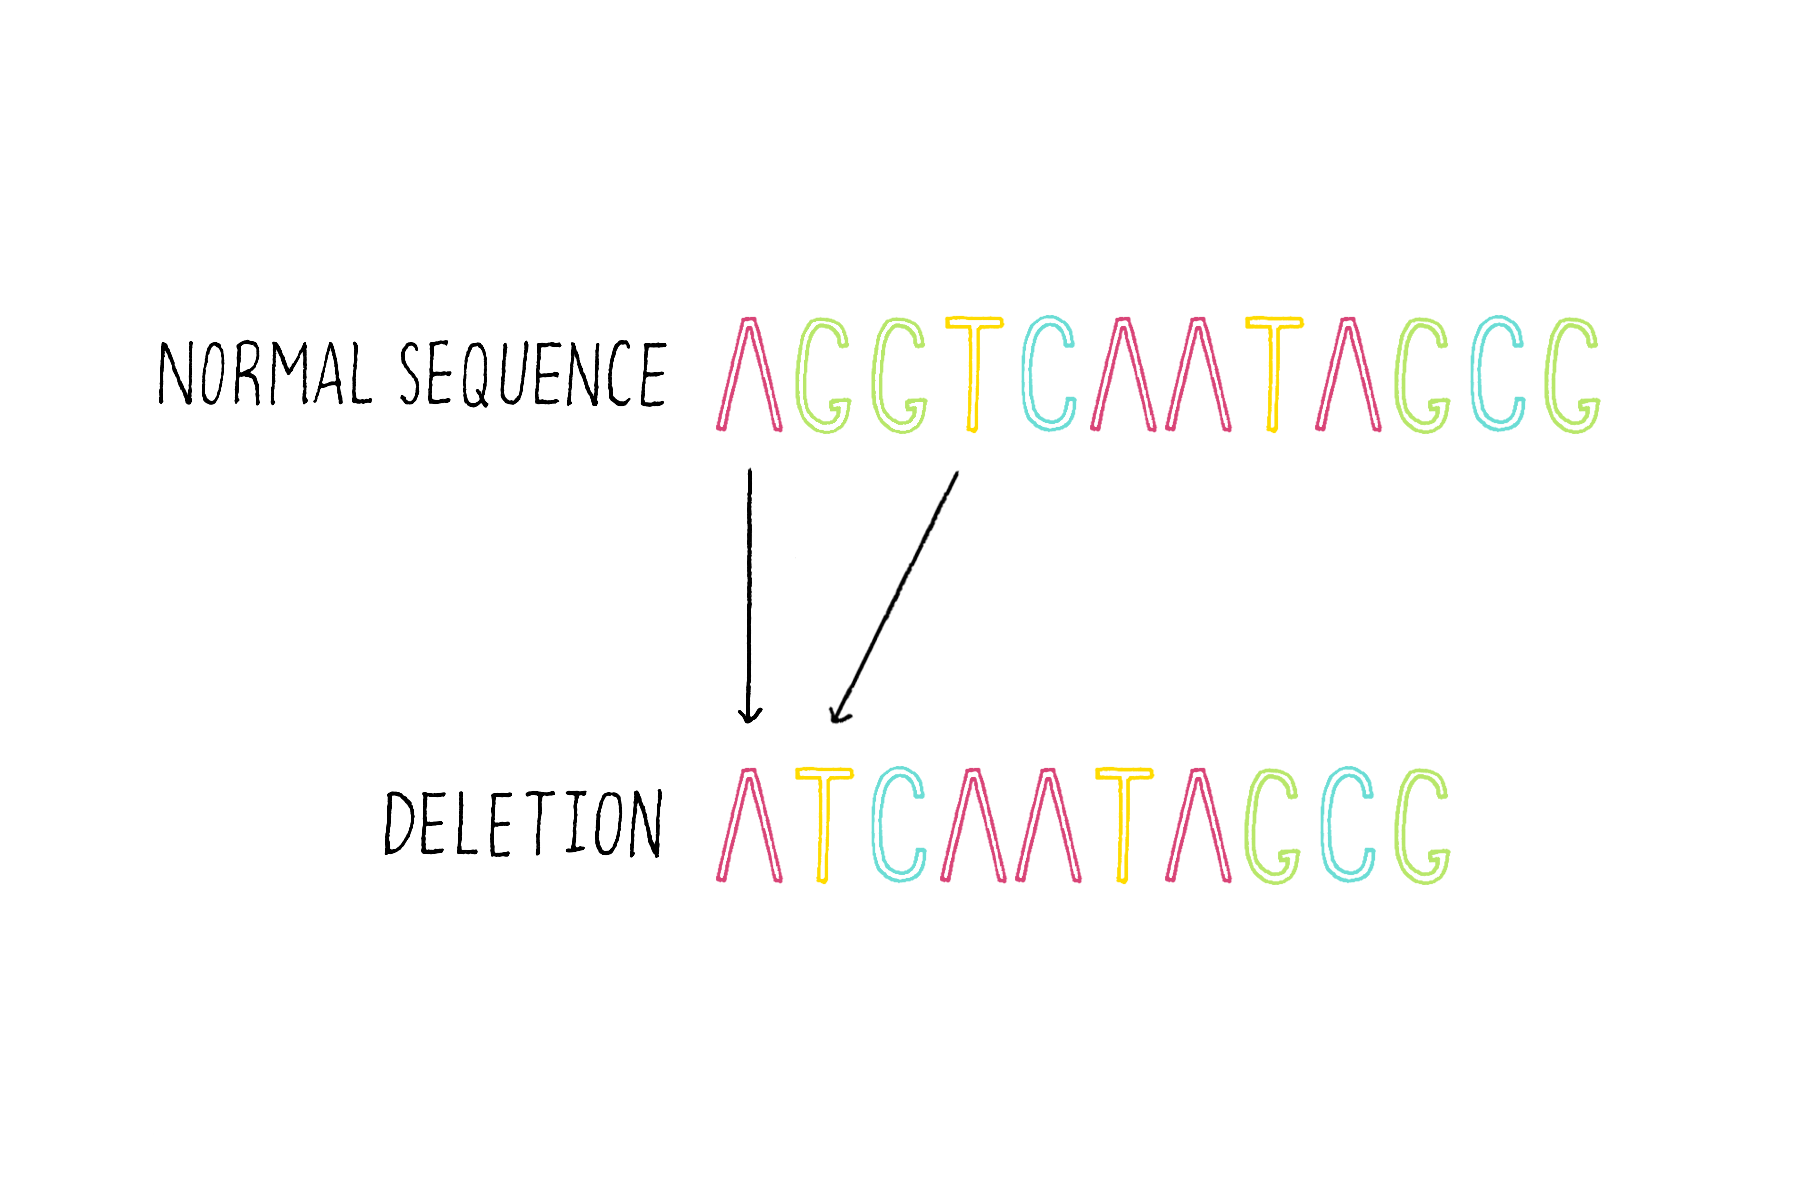
3) Deletions – the removal of one of more bases (Figure 18).
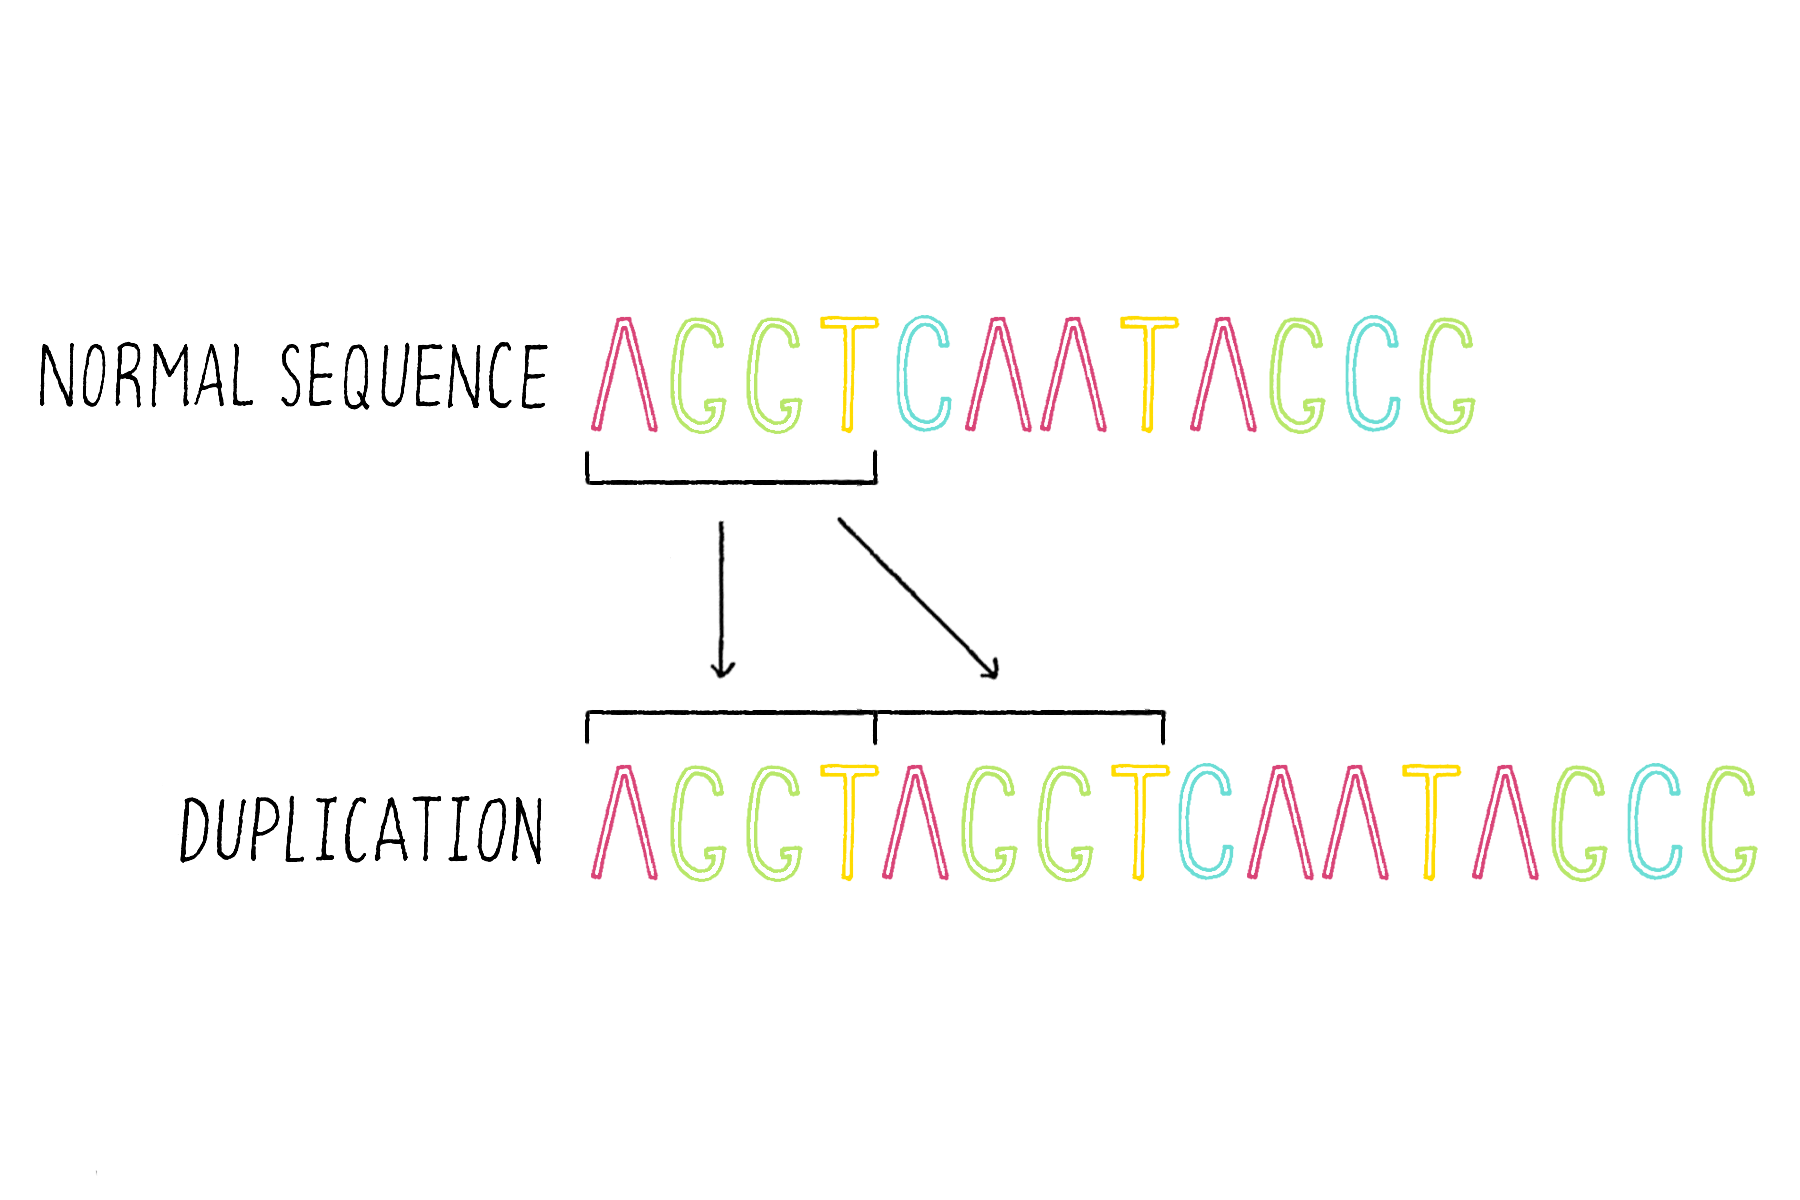
4) Duplications – duplicating and consequently adding more copies of the same DNA sequence (Figure 19).
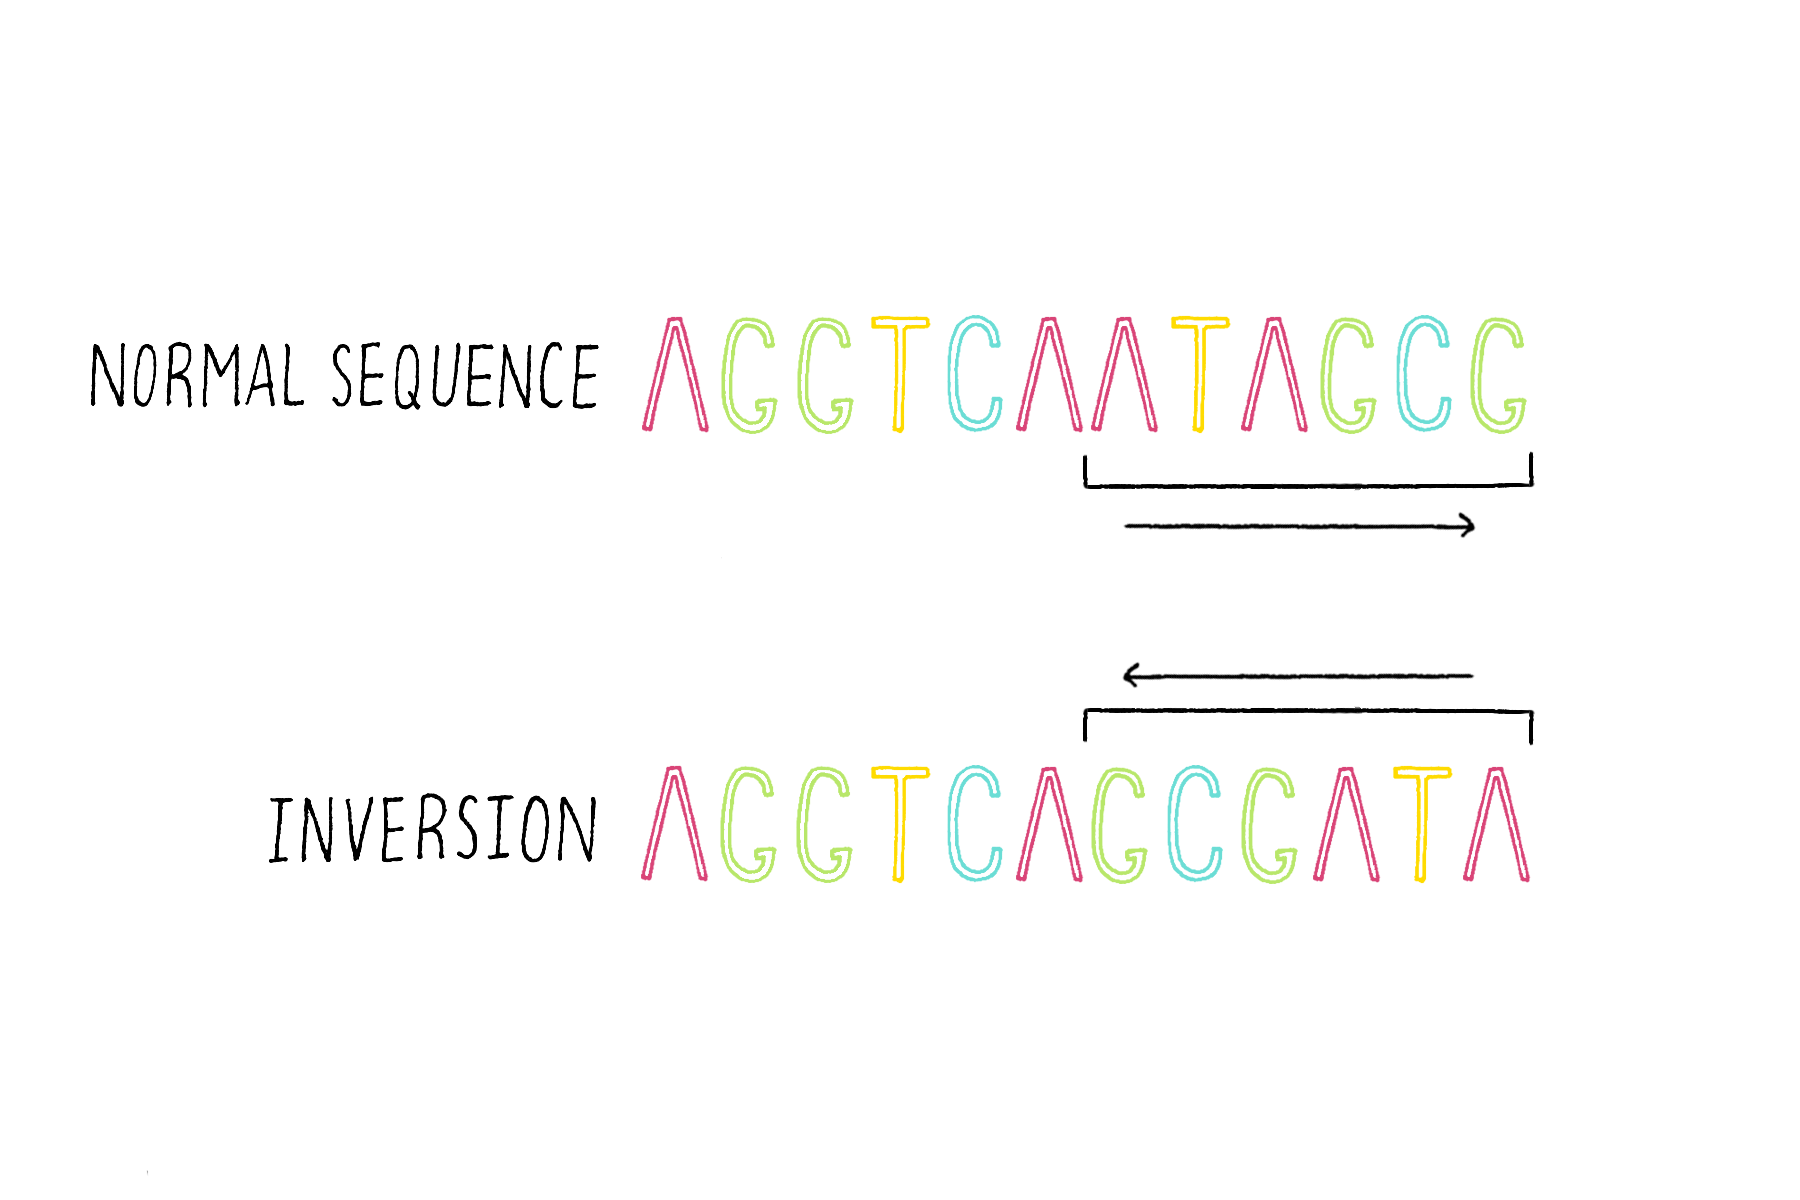
5) Rearrangements
Inversions – the flipping of a region of DNA (Figure 20).
Translocations – the transfer and attachment of a DNA sequence of one chromosome to another chromosome (Figure 21).
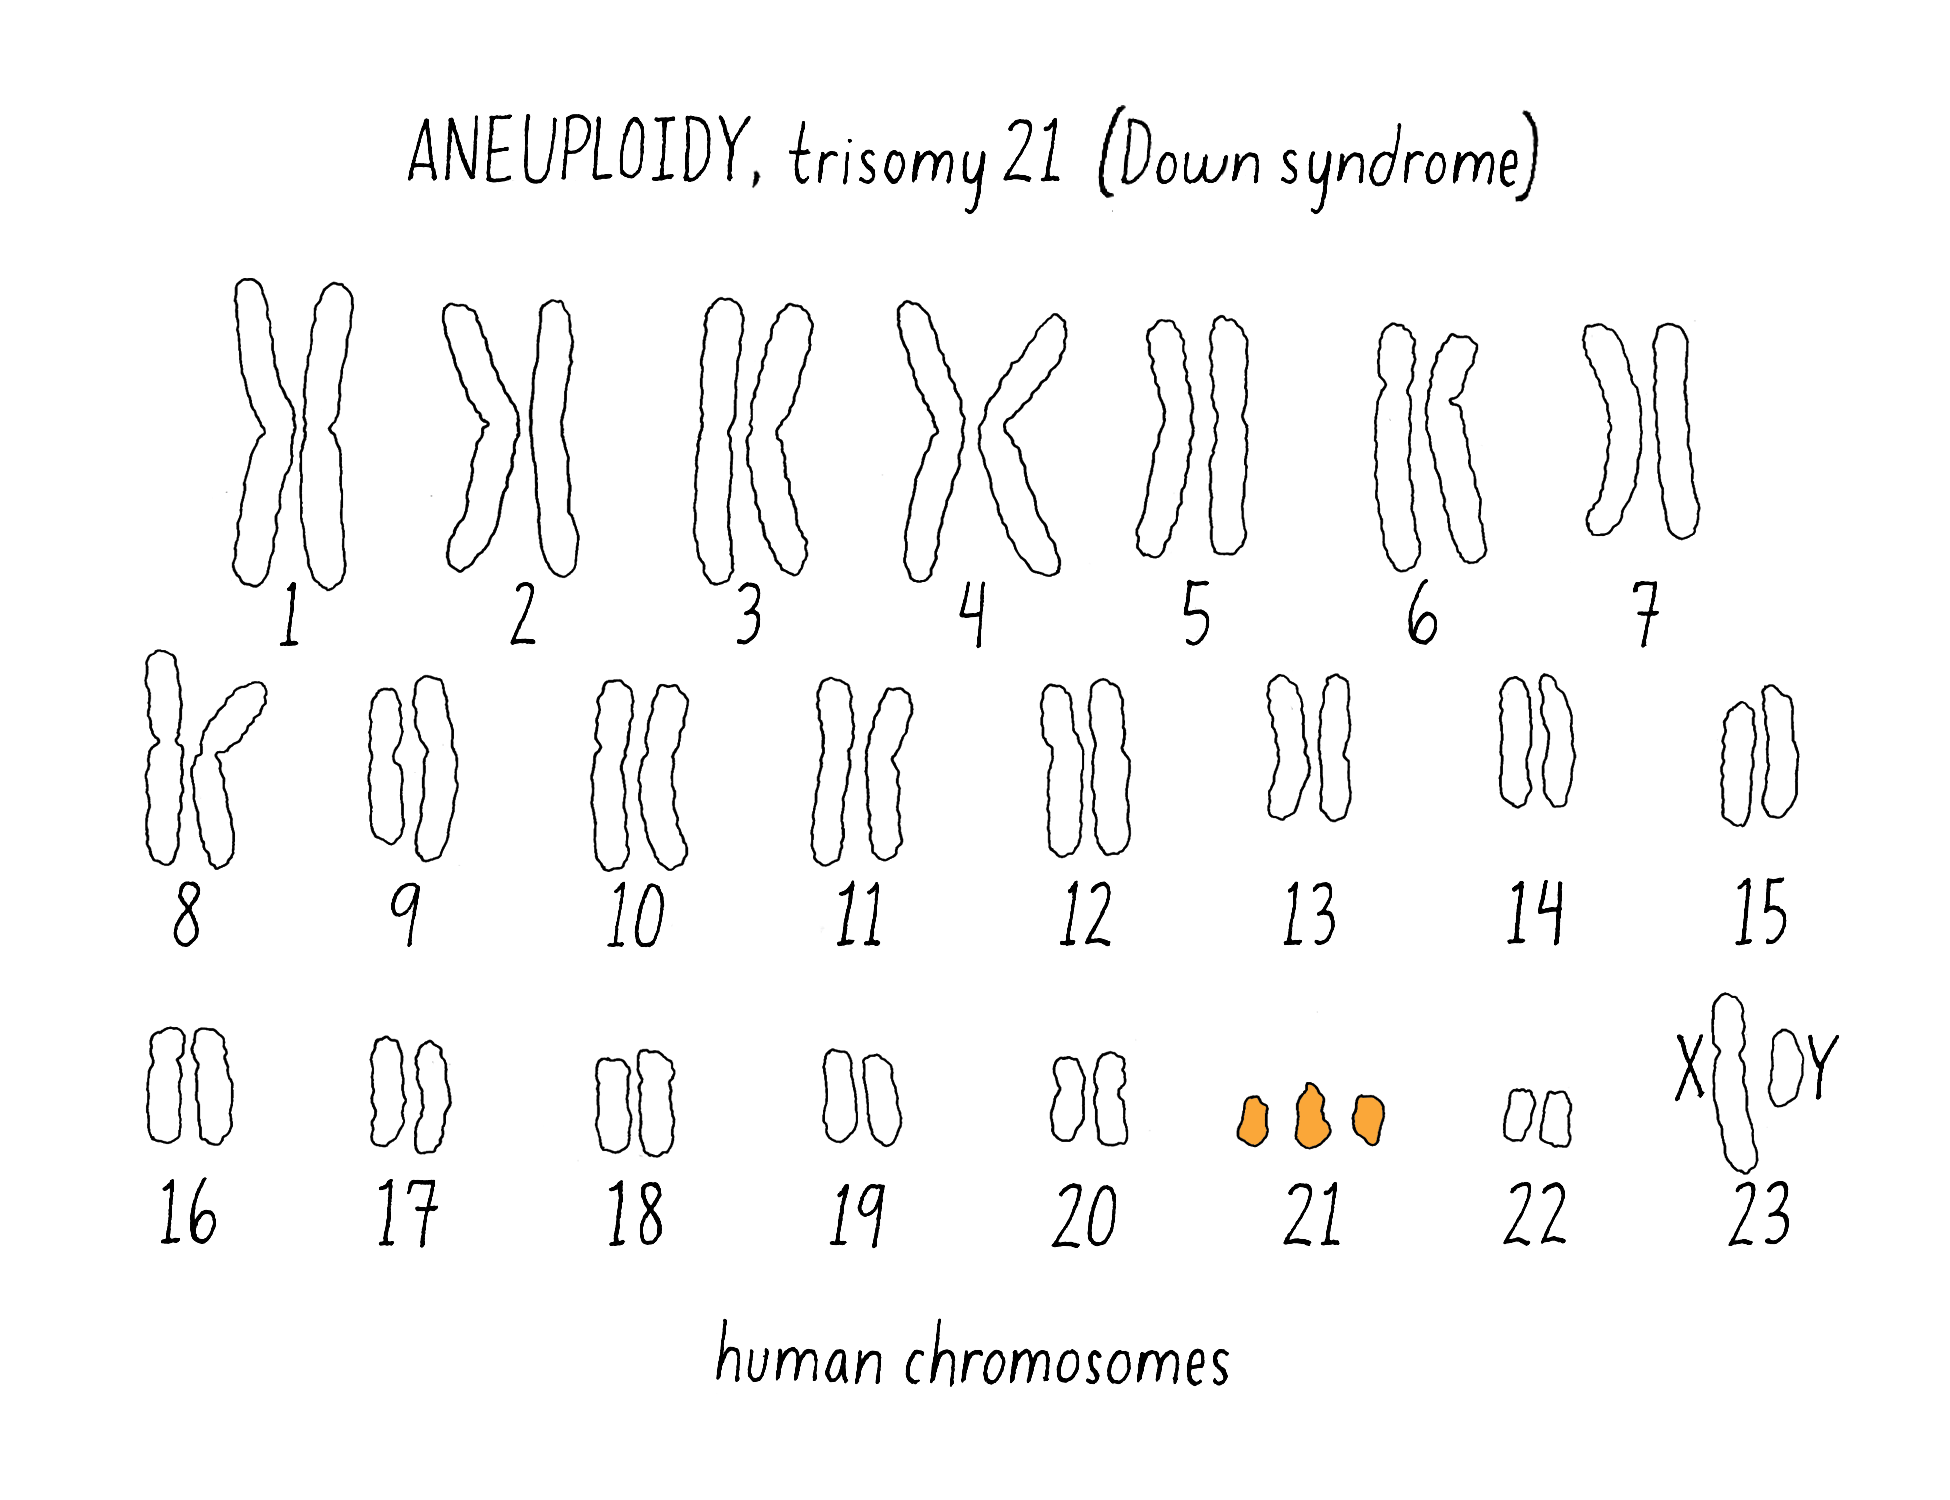
6) Missegregation of an entire chromosome
For example, missegregation during meiosis in more or fewer copies of the normal number of two copies of each chromosome. The abnormal number of chromosomes is called “aneuploidy” (Figure 22). In humans, an extra copy of chromosome 21 gives rise to the developmental defects associated with Down syndrome and more extensive aneuploidy is a hallmark of many cancers.
The effect of mutations on gene function and the generation of new traits
To understand how these different types of mutations affect gene function, we need to understand how genomes and genes encode information. The DNA sequences within genomes can be divided into two categories, coding and non-coding. Coding sequences are the genes that provide the blueprints to synthesize particular functional products. The products determine the functions of cells, which in turn manifest as traits in the organism. Only ~1% of the human genome is coding sequences.
The immediate product of a gene is an RNA copy of the gene. The RNA can directly perform important biochemical functions. However, in most cases, it is a messenger RNA (mRNA) that directs the ribosome, the cellular protein synthesis machinery, to synthesize a specific protein. Ribosomes use a three base code in the mRNA to direct polymerization of amino acids in a specific order. The chain of amino acids folds into three-dimensional proteins. Proteins are the molecular machines and building parts that carry out most biochemical functions and determine most of our traits
The consequences of mutations on the protein product differ depending upon the nature of the mutation. Single base substitutions that lie within the coding sequence will leave protein function unchanged because 1) either they do not change the amino acid sequence of the protein (some amino acids are encoded by several three letter codes), or 2) the amino acid substitutions in the chain are compatible with the protein’s function.
Other single base substitutions will cause substitutions that alter the quality of the protein’s function and give rise to new traits. For example, the hemoglobin protein carries oxygen in red blood cells. A single base change (GAG to GTG) in the hemoglobin gene encoding causes a valine substitution for glutamic acid that is the basis for two new traits, sickle cell anemia and resistance to malaria (see the Narrative on The Laws of Inheritance by Tilghman). Insertions or deletions can be even more deleterious, since they can eliminate large pieces of a protein. Insertions or deletions can also shift the reading frame of the mRNA, which changes all of the amino acids after this mutation.
Finally, other types of mutations can alter how much of a protein is produced but not change the protein per se. Sometimes mutations in non-coding regions can affect protein levels by changing how much of the gene is transcribed into mRNA. Gene duplications described above can also increase the amount of a protein that is produced.
All of the mutations described above are common in cancer. Specific alterations in proteins and/or changes in their levels contribute to the mis-instructions that cause cancer cells to divide and divide in an uncontrolled manner.
How mutations form
DNA replication errors
Why do spontaneous mutations occur? As an ending side note in the study by Luria and Delbrück, they reported that once a bacterial culture stopped dividing, the number of phage-resistant cells in the culture remained constant. This result suggested that the mutations occur during the process of cell division. The nature of mutation formation and correction involves understanding DNA replication and repair. These topics will be covered in a later narrative (to be produced) but a brief explanation is described here.
The task of transmitting the genetic content from one generation to the next is mindboggling. The hereditary information of a species can range from a few million base pairs in most bacteria to 15 billion in wheat or 3 billion in humans. All this information must be copied and distributed to the progeny. For example, when an E. coli proliferates to generate a billion cells in a culture, its 5 million base pairs must be replicated and distributed almost a billion times overnight. To give perspective, an average book has 10-fold less information (500,000 letters). Do you think humans could make a billion copies of a book, even with machines, and make no mistakes? Not surprisingly, the hereditary machinery like publishing companies, has functional limitations. Failures during DNA replication can lead to first five types of mutations listed above.
To replicate DNA, cells have complex enzymatic machinery that generates a copy of the existing sequence of DNA bases by using the complementarity of DNA base pairing (see the Narrative on DNA Structure by Vale). The machinery misreads the complementarity for any given base of the genome about once every million cell divisions, inserting the wrong base. However, cells also have proofreading mechanisms (molecular copy editors) that recognize the potential mistakes and correct them with 99% efficiency. As a result of DNA repair mechanisms, this total error rate in DNA replication causes any given base in a genome to change only once in 100 million cell divisions. With this error rate, about 1 in 20 bacterial progeny will inherit a single base change that differs from the millions they inherit from their parents. In humans, each baby inherits a few hundred base changes that differ from the billions it inherits from each of its parents.
The DNA replication machinery can also slip by failing to read or rereading one or more bases. This slippage results in deletions and insertions. Sometimes the replication machinery gets stalled. The stalled replication eventually collapses. The collapse often causes the DNA to be broken. The cells attempt to fix the broken DNA, which often leads to the rearrangements and duplications. These types of errors in DNA replication generally happen less frequently than misreading of base complementarity.
Environmental Insults
Cells have to overcome not only the inherent complexity of DNA replication but also the inherent reactivity of DNA. The sugar and bases of DNA are loaded with reactive atoms like nitrogen and oxygen and reactive chemical bonds. These reactive atoms and bonds are all targets of mutagens, mischievous environmental agents such as small molecules or radiation (ultraviolet and X-ray). These mutagens enter the cell and either cleave the bonds or alter the chemical structure of the bases. Cells have potent systems to repair mutagen-induced DNA damage, but like the replication system, the repair systems are not perfect. Damaged DNA that escapes proper repair can cause permanent mutations that are passed onto the progeny of the mutated cell, which is also the basis of many forms of cancer (see the Narrative by Bishop on Cancer Genetics).
The relationship between new mutations and the generation of new traits
How often do these spontaneous mutations generate a mutation that alters a protein’s in a way that generates a new function? Let’s assume that a trait such as bacteriophage resistance is caused by a single gene (for example encoding a protein that helps the phage dock onto its surface). An E. coli bacterium has ~4000 genes encoded by 5 million base pairs or about 1000 base pairs per gene. So the probability of spontaneous mutation in a gene per cell division is 1000 base pairs × 10-8 changes per base pairs per cell division or one base pair change per 10-5 per cell division. Thus, one in a hundred thousand bacteria will have a mutation that alters one of the bases within a specific gene.
However, many spontaneous mutations in a gene won’t cause a trait change either because they do not change the code for the amino acid or the change to another amino acid does affect the protein in a way that alters the trait (as discussed earlier). Alternatively, they eliminate the protein, which often kills the cell or organism. Death is not an inheritable trait. Indeed, because of these mitigating factors, only about 1 in 100 to 1 in thousand spontaneous mutations in a gene actually alter the gene sufficiently to produce a new trait. The total number of bases that can be mutated to a trait is called the “target size.”
In summary, we have identified three factors that allow us to predict the number of individuals in a population that will have acquired a new trait:
1) the target size (the number of bases that can be mutated to give the trait),
2) the spontaneous mutation rate (the number of mutations for a given base/round of replication), and
3) the number of rounds of replication (the proliferation of the population).
The product of these factors gives an estimate of number of individuals in a population that will have a mutation in a given target and therefore evolved a new trait. We will see how these factors influence modern drug design in the Frontier section.
Part III: Frontiers —
The role of mutations in resistance to HIV (AIDS) and cancer drug therapy
Resistance to HIV drug therapy
Now let’s turn to the present to see how the Luria-Delbrück experiment and the subsequent molecular and quantitative understanding of spontaneous mutation impact our lives today.
As a first example, we will discuss one of the greatest triumphs in modern medicine, the development of the remarkably successful treatment of acquired immune deficiency syndrome, AIDS. Until 1995, AIDS was a fatal disease that caused a painful and debilitating progression of symptoms and eventually death within a decade. Even today, 1.1 million people around the world die from AIDS each year. Of the 37 million individuals who are living with AIDS, many are symptomless and have a normal life expectancy because they are fortunate enough to receive novel drug treatments. Saving the quality and quantity of life for millions of humans with AIDS is a remarkable triumph. Quantitative analysis of the spontaneous mutation rate was absolutely critical to the development of these successful treatments.
AIDS was a mysterious disease until researchers discovered that it was caused by the virus HIV (human immunodeficiency virus). An animal virus is similar to a bacteriophage only that it invades animal cells. HIV replicates in a white blood cell called a T cell which plays an important role in fighting infections. If untreated, HIV will eventually kill most, if not all, of these cells. Without a proper functioning immune system, patients get a large number of disorders, which eventually lead to death.
Knowing that HIV was the cause, the way to treat the AIDS became clear. Kill the virus. The conventional way to kill a virus is to stimulate the immune system through a vaccine. However, HIV is particularly good at avoiding the immune system making it refractory to this approach. Without an easy way to generate a vaccine, scientists turned to drugs.
To understand potential drug therapy, we need to learn some animal virology (Video 6). Most viruses, like phage, store their hereditary material as DNA inside the viral shell called a capsid. Upon entering the target cell, viral DNA is transcribed into mRNA to make the viral proteins. Some viral proteins help make more viral DNA while others provide the building blocks to make a new viral capsid.
HIV is among the unusual class of viruses called retroviruses. Retroviruses store their hereditary material as RNA inside the capsid. The RNA is reverse transcribed (hence the name retrovirus) by an enzyme called reverse transcriptase to make viral DNA. The retroviral DNA promotes virus formation just like any DNA virus. However, the capsids package the RNA instead of the DNA inside of the virus. If you want to learn more about reverse transcriptase and its Nobel Prize discovery, see the Whiteboard Video on Reverse Transcriptase.
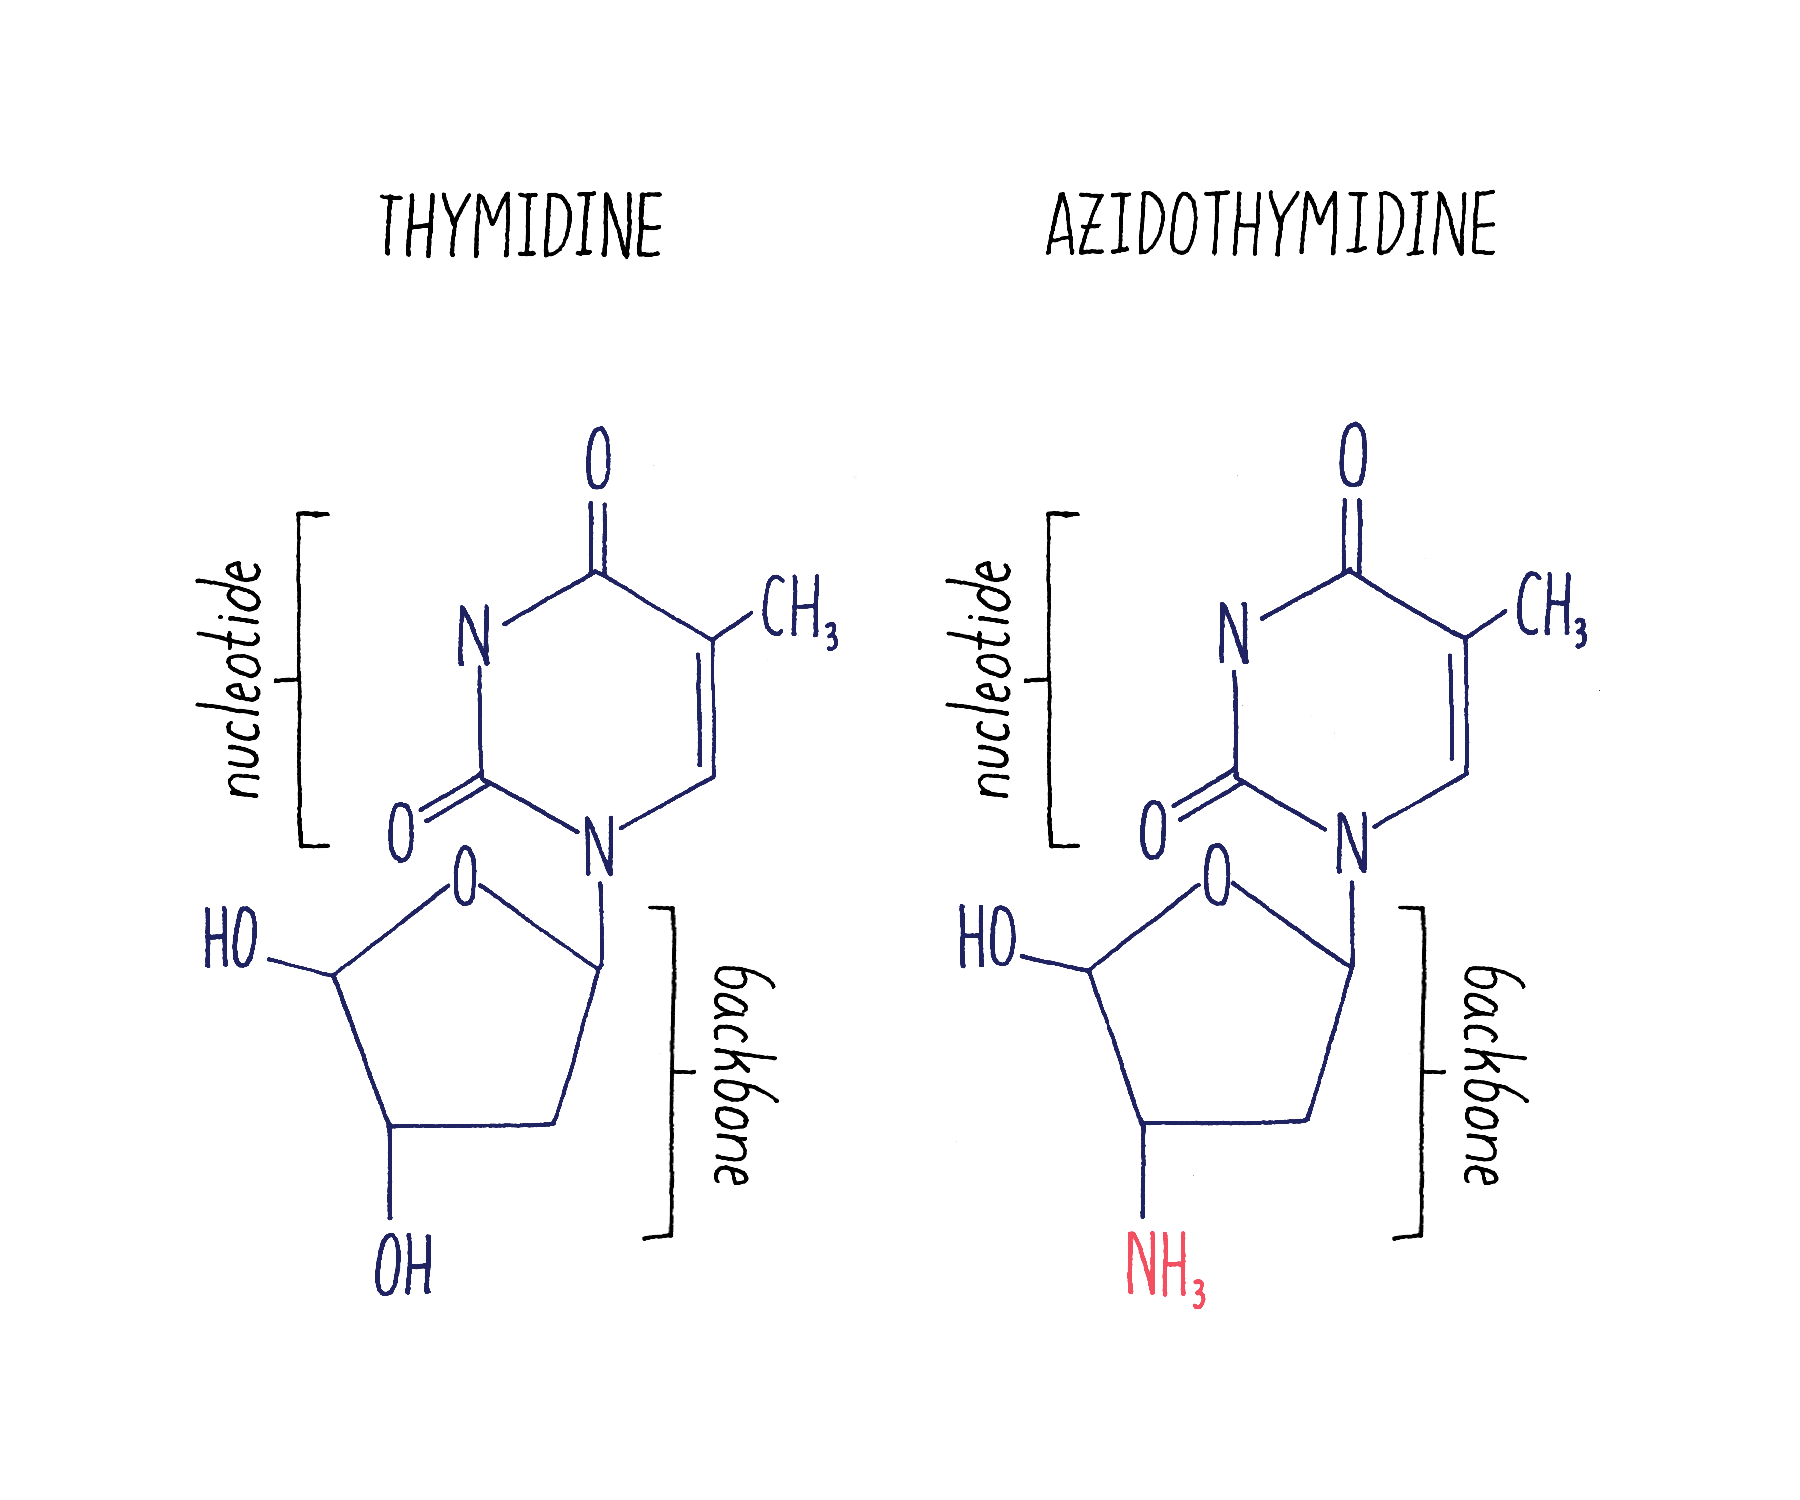
Because retroviruses were thought to cause several types of cancers, scientists and companies had developed drugs that bind to reverse transcriptase and block its function. One of these drugs was AZT (azidothymidine; Figure 23).
The mechanism of how reverse transcriptase works and how it is blocked by AZT is shown in Video 7.
Scientists hypothesized that by blocking reverse transcriptase, AZT would render HIV powerless to replicate its genome and make more viruses. So, they tested AZT’s ability to block HIV replication first in T cells grown in cell culture and then in human trials. AZT was really potent. The HIV levels in blood samples went way down and the patient’s symptoms abated, a smashing success, except for one small problem.
The effect of AZT went away, and AIDS came back. HIV also encodes a protease that is essential for the activation of RT. Scientists found additional drugs like ABT-538 that bound to and inhibited the protease. However, ABT-538 behaved just like AZT, initially causing AIDS symptoms to go away only to have them come back.
Explorer’s question: Why do you think that AZT and ABT-538 became ineffective?
Answer: A small number of viruses in the patients had acquired spontaneous mutations in their viral genomes that conferred resistance to these drugs. AZT is structurally very similar to dTTP, one of the four building blocks of DNA. RT mistakenly uses AZT instead of dTTP when it synthesizes viral DNA. The misincorporated AZT blocks further DNA synthesis from the RNA template. DNA sequencing of the AZT-resistant viruses revealed that they had acquired spontaneous missense mutations that changed just a few very specific amino acids in the reverse transcriptase. The mutant RT structure prevents it from using AZT as a substitute for dTTP , allowing the DNA synthesis to proceed to generate a full DNA copy of the RNA. Similarly, ABT-538-resistant viruses had acquired spontaneous missense mutations that change a few very specific amino acids in the protease. These mutations blocked ABT-538 from binding and inhibiting the protease.
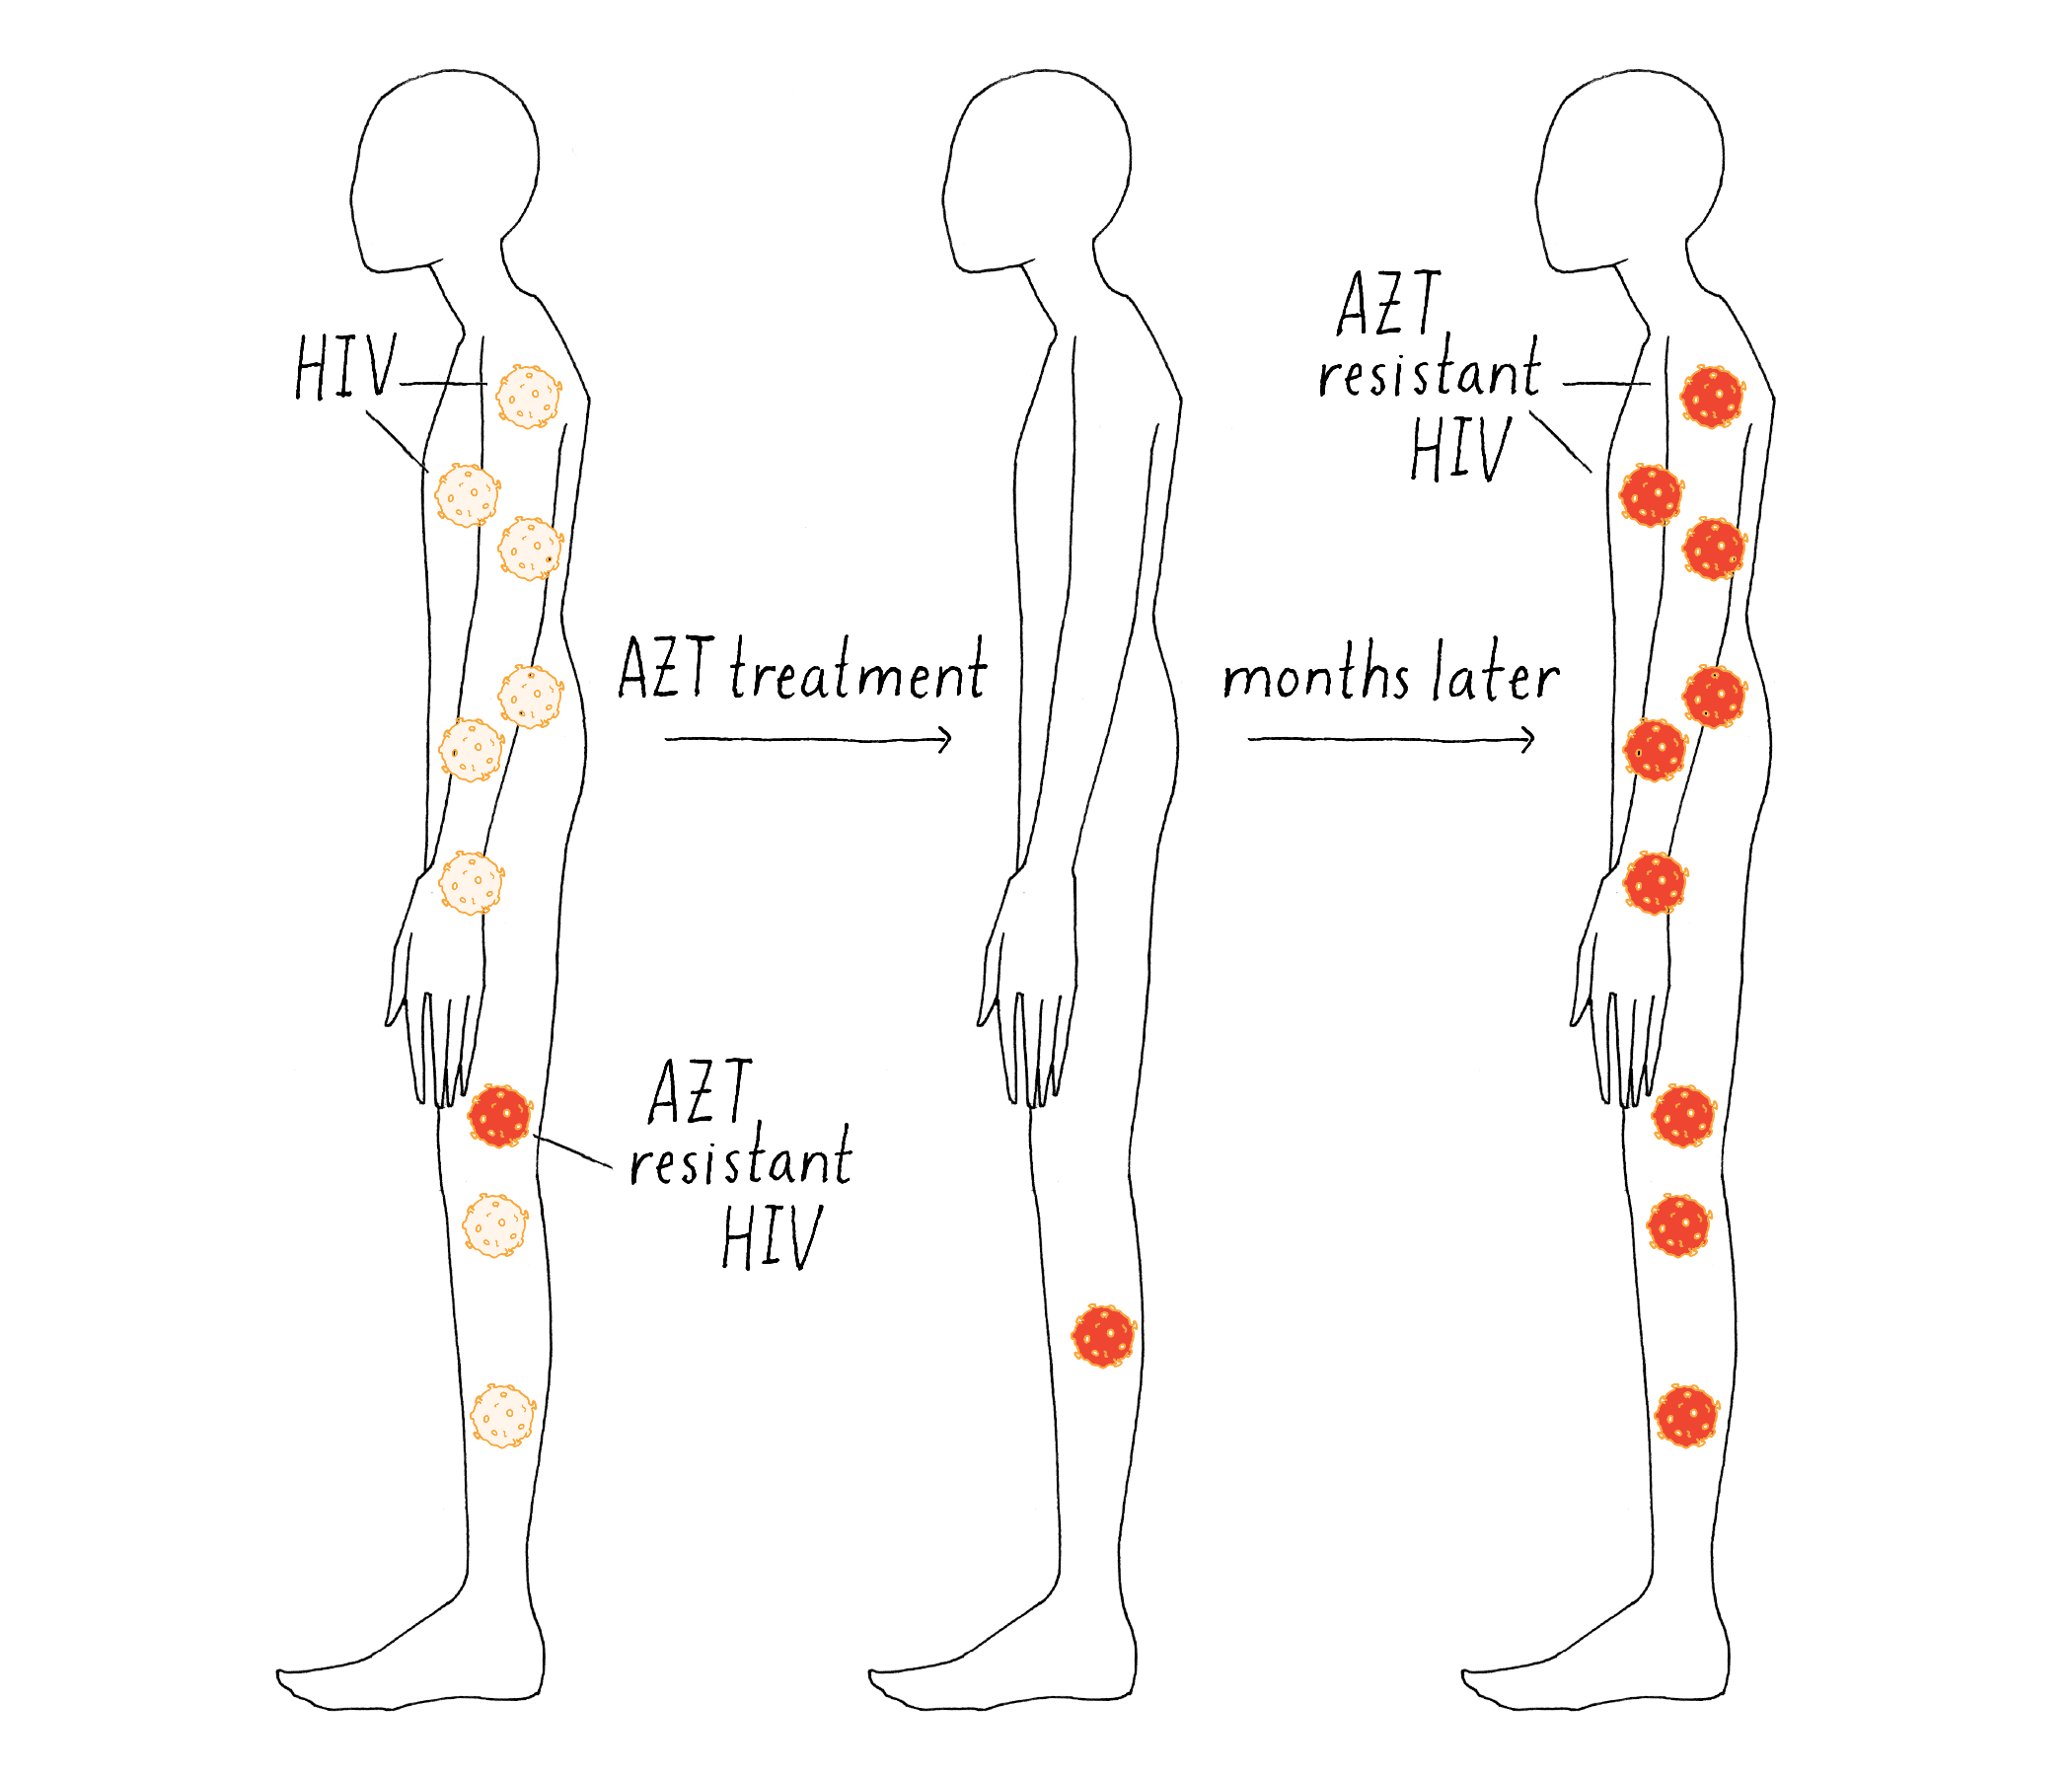
The existence of these rare viral mutations explained the patients’ response (Figure 24). Each drug would initially kill most of the viruses in the patient; hence, the viral titer would go down and the symptoms would go away. However, the few viruses with the resistant mutations could proliferate in the presence of drug, and the disease would come back.
Do all AIDS patients have AZT or ABT-538-resistant virus? From the Knowledge Overview, we learned that:
The probability of a trait in individual of a population is equal to
(rate of spontaneous mutation) × (target size) × (number of rounds of replication)
The target size for AZT or ABT-538 resistance is just a few bases because only a few bases in the whole viral genome can be changed to make the critical amino acid substitutions in RT to interfere with the binding of the drugs. Scientists measured the spontaneous mutation rate for HIV. A substitution for any base in the HIV genome occurs once every 10,000 rounds of replication. This error rate for this virus is much higher than the error rate for human DNA replication.
The missing value in calculating the number of drug-resistant virus in a patient was the number of rounds of viral replication in the body. However, determining this value was problematic. Scientists knew that the levels of HIV in the blood of AIDS patients were constant over time. The only way to explain this constancy was a balance between viral replication in the patient and its clearance from their blood. Imagine a bathtub with water maintained at a certain level because the faucet is adding new water, but the drain is opened just enough to allow the equivalent amount of water out.
The low constant levels of HIV could be explained by two possible models. In one model, the virus replicates infrequently but also persists in the blood for a long period of time. In this model, imagine a bathtub with water maintained at a certain level by the slow input from the faucet and the slow output of water from the drain. In an alternate model, the virus replicates at a much higher rate, but most of the viruses are cleared rapidly from the blood, for example by the immune system. In this second model, imagine the bathtub maintaining a constant amount of water with the faucet fully on and the drain fully open.
Although drugs like AZT and ABT-538 were flawed medical treatments, David Ho and colleagues realized that they could be used as the missing tool to measure HIV replication. These drugs should block new HIV replication (shutting off the faucet). Virus titer in the blood should then go down as a function of the clearance rate (how open is the drain). By determining the clearance rate (how fast the water was leaving the tub), they would also determine the replication rate in the absence of the drugs (how open is the faucet) to keep viral levels constant (to keep the water level constant).
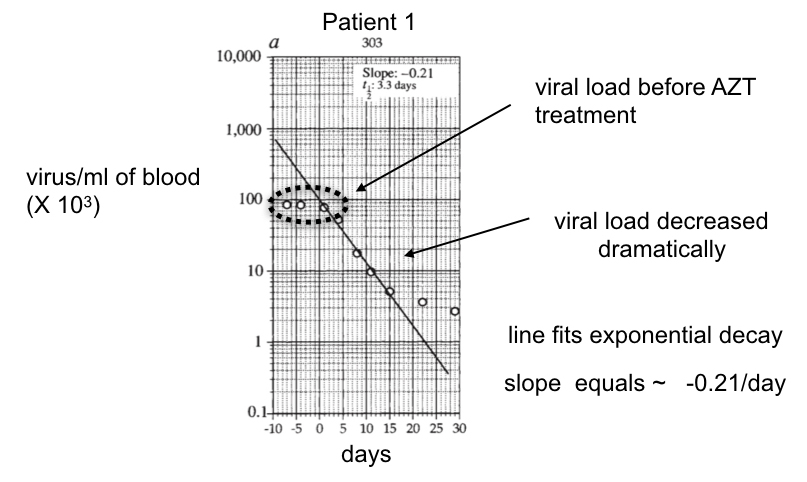
Ho and colleagues followed the viral number per ml of blood from 10 days before the administration of ABT-538 until 30 days after (Figure 25). The viral titer did not change during the first 10 days, corroborating that viral replication and clearance were balanced in the patients in the absence of ABT-538. After the addition of ABT-538, the viral titer decayed exponentially, as revealed by the approximately straight line on this semi-log plot for the first 15 days after taking the drug.
In the case of ABT-538 treatment, the average of the slopes from all patients treated with ABT-538 equals the average rate constant for viral clearance per patient (see Dig Deeper 4 to understand why). By taking this value for the rate constant and multiplying it by the average number of viruses/ml at time 0 (just before ABT-538 was given), Ho and colleagues calculated the viral clearance rate in the absence of ABT-538, which was 1.3 × 10⁵ viruses cleared from 1 ml of blood per day.
An average person has 5 liters of blood, so the total viral clearance was 6 × 10⁸ viruses per day. Since the clearance rate must equal the replication rate to keep the viral concentration in the blood at a constant level, the replication rate was 6 × 10⁸ new viruses/patient per day.
Ho and colleagues now had the three values to calculate the number of ABT-538-resistant virus generated in a patient each day:
10-4 mutations/base/round of DNA replication (spontaneous mutation rate) × 2 bases (target size) × 6 × 10⁸ new viruses (equal to the rounds of replication) produced per patient per day.
The answer was astonishing – patients were generating, on average, 120,000 ABT-538-resistant viruses per day! Many of those were likely cleared by the body, but some survived and gave rise to more resistant progeny. No wonder why the disease came back! The main realization, harkening back to the Luria-Delbrück experiment, is that the spontaneous mutation will likely result in the failure of any viral drug treatment that involves only one drug. The drug will produce transient remission of the symptoms, but pre-existing resistant viruses will grow up and disease will resume.
However, Ho and co-workers reasoned that the outcome might be very different if the patient was treated with multiple drugs that bound to distinct sites on the same or different viral proteins (like AZT and ABT-538). The probability of a virus being resistant to two drugs simultaneously was the product of acquiring a resistant mutation for each drug (10-4 × 10-4 = 10-8). If we assume the probability of resistant mutation for each new drug is similar to ABT-538 resistance, then an average patient would generate only 12 viruses per day that were resistant to two drugs. If there were 3 drugs on board, less than ~1 in 1,000 patients would generate a virus resistant to three drugs in a day. With this realization, the multidrug-resistant approach to HIV infection was born! Indeed, three drugs are now used to treat HIV. This treatment, called “ART” after the initials of the three drugs, saves millions of lives every year, all because of a quantitative approach to understanding spontaneous mutation rate.
It is important to note here how much quantitation and quantitative thinking was critical for success. Scientists were not satisfied to know that patients had HIV or that HIV acquired mutations that made it drug resistant. Rather they sought to provide quantitative numbers to each of these descriptions. Ho stood on the shoulders of other quantitative thinkers who realized the value of knowing exactly how many HIV viruses were in a patient’s blood and what exactly was the rate of spontaneous mutation rate of HIV.
Explorers question: Does the effectiveness of ART depend upon how long the patient goes before he or she learns she has HIV?
Answer: Yes. After 2000 days (6 years), the mean number of virus resistant to all three drugs per patient is 1 (1 resistant virus per day per 2000 patients × 2000 days). With this mean we can calculate p(0), the fraction of patients 6 years after infection with no resistant virus as 0.37. As a corollary the fraction of patients with at least one virus resistant to all three drugs would be 1-p(0) or 1 – 0.37. The ART treatment would fail in 2/3 of the patients that waited this long to get treatment.
Explorer’s question: Let us take another common viral infection – the common cold. A new drug has been developed to cure a cold. Ten days after infection, the cold virus will have replicated enough times such that each patient, on average, will have acquired one virus that is resistant to the drug. Your medical colleagues argue that you should not administer the drug to patients at day ten. You argue, based upon your knowledge of Poisson distributions that you learned in the Journey to Discovery, that administering the drug at that point would still benefit some patients. Explain the logic behind your argument. What proportion of patients would you expect to benefit from treatment at that point?
Answer: With a mean of each patient having had one spontaneous mutation to resistance, the Poisson distribution tells us that many patients will not yet have acquired any mutations to resistance. In those patients, the drug will kill all of the sensitive viruses and the patient will be cured. In this case, the mean is 1 and the outcome is 0 (patients with no resistant virus). The equation for the Poisson distribution is P(x) = e-mmx/x! P(0) = e-m for m=1 P(0) = 0.36. So 36% of the patients will be cured by the drug.
Mutations and cancer
Spontaneous mutations are also critical players in the most prevalent human killer, cancer. As we have discussed, spontaneous mutations cannot be avoided, because they are an inevitable consequence of cell division. In multicellular organisms, we usually think about these changes in the context of sperm and eggs that generate new traits in offspring. However, spontaneous mutations can also occur in asexual cell divisions of the somatic cells of multicellular organisms that form and maintain body structures like organs, tissues and blood. The mutation rate of somatic cells, which comprise most of the body, has been estimated to be about 10-fold greater than that of the germ line cells that produce gametes. These somatic mutations can cause new traits just as they do in the asexual divisions of bacteria. One of the most profound and unfortunate example of new traits is cancer. Since spontaneous mutations cannot be avoided, cancer is an inevitable consequence of life even in a perfect unchanging environment. The mechanism of generating cancer is discussed in more detail in the Narrative on Cancer Genetics by Bishop.
Furthermore, as we learned in the Knowledge Overview, many environments have mutagens. Mutagens that induce somatic mutations and elevate the acquisition of cancer are called carcinogens. As a way to rank potential carcinogens, Bruce Ames developed a bacterial system (are you surprised?) that was very sensitive, rapid and quantitative for assessing whether specific substances or agents were mutagens.
Ames first tested a number of man-made substances in the environment like a flame retardant chemical used in pajamas or chemicals in hair dyes. Some were particularly potent in elevating spontaneous mutations rates and later were shown likely to induce cancer in animal model systems. These studies led to the current healthy caution toward synthetic compounds made by humans. However, he later tested many of the so-called natural products or old-fashioned human activities. Charred meat from a barbecue was a very potent mutagen. Of course, we also now know that our good friend the sun is the major carcinogen for skin cancer. Importantly nature is not inherently good or benign. Our environment, both natural and man-made, along with inherent replication errors leads to the acquisition of new traits inevitable, sometimes for the better and sometimes for the worse.
The ramifications of spontaneous mutations extend beyond just the cause of cancer to its treatment. Chemotherapy to kill cancer cells recapitulates AZT or ABT-538 treatment of AIDS patients. Treatment with a single anti-cancer drug usually results in remission of the cancer but is then followed inevitably by a reoccurrence of cancer growth, now in drug-resistant form. Two cancer biologists, Goldie and Coldman, emerged with an important insight about treating tumors after reading the paper by Luria and Delbrück. In 1979, they published that resistant cancer likely arose spontaneously in the tumor cells while the tumor was growing prior to the chemotherapy. The bigger the tumor, the more cell divisions must have occurred – the more likely a subset of its cells would have acquired spontaneous mutations to drug resistance. They suggested that by removing as much of tumor by surgery as possible, they would increase the probability of removing all if not all of the rare drug-resistant cells. Chemotherapy post surgery would then be more effective. They also proposed treating with multiple drugs simultaneously (sounds familiar?). Surgery followed by chemotherapy is the standard practice, all thanks to Luria and Delbrück.
Why isn’t chemotherapy more successful in curing different cancers? The target size for mutations for spontaneous drug resistance can be quite large as mutations in many proteins can give rise to drug resistance. Furthermore, a natural response to toxins impedes the effectiveness of the drugs. When our cells are exposed to toxins, our cells induce the production of cellular pumps that extrude the toxin from the cells. These same pumps can pump out multiple cancer drugs simultaneously, thereby providing simultaneous resistance to multiple drugs. Remember the HIV treatment depends upon the fact that the acquisition of resistance to one drug is independent of the acquisition to drug resistance by another drug because the drugs have different targets. Another complication is that many patients become sick or die from the side effects of the anti-cancer drugs. They cannot tolerate more than 2 drugs at a time. This patient variability in drug tolerance is also likely determined by spontaneous mutations, albeit ones that are inherited from their parents through the germ line (sperm or eggs). A hope is that a better understanding of somatic and germ line mutations that impact drug resistance and drug tolerance can be identified by DNA sequencing of normal and tumor cells from cancer patients. With this information, more effective personalized drug therapies can be designed.
However, new technology and treatments are changing this landscape. Scientists are gaining a much better understanding of cancers and their mechanisms of drug resistance in individuals through genome sequencing and molecular studies (see the Narrative on Cancer Genetics by Bishop). New immunotherapy approaches are also emerging that boast the immune system’s capability of clearing tumor cells. A major unanswered question in medicine is how to use the wealth of new genomic information about an individual’s particular cancer to overcome the insidious effects of spontaneous mutations that allow dividing cancer cells to become resistant to drug therapy.
Closing Thoughts
A quantitative understanding of spontaneous mutation rate challenges our perception of which species are more evolved. In the Introduction, I suggested that a low spontaneous mutation rate allows a species to probe its biological potential by generating only a few progeny with a new trait. Most progeny retain the traits of their parents and thus are capable of proliferating under the existing conditions. We also learned that the spontaneous mutation rate for the human germ line is approximately ten-fold more than E. coli. However only 100 billion humans have ever lived on Earth while 100 billion E. coli can grow in a test tube in a day. 1031 bacteria exist right now. These remarkable proliferation numbers are characteristic of many microbes including fungi. Simply by proliferating more, microbes have explored much more of biological potential than humans.
So who is more evolved? Indeed humans can think. However, bacteria can also communicate with one another (see the Narrative by Bassler on Quorum Sensing). Bacteria can live in the hydrothermal vents of Yellowstone that would boil us or in rocks under extreme pressures that would crush us. One fungus can generate neuropeptides that cause their wasp hosts to crawl to the top of a tree, become paralyzed, and then die, thereby allowing the fungal spores to fall onto uninfected hosts below.
Are these microbes with remarkably evolved traits the tip of the iceberg? Undoubtedly yes. Recent DNA sequencing studies revealed that spontaneous mutations have caused the evolution of the vast numbers of bacterial species that were previously unknown because we could not culture them. One clear lesson from my years as a scientist is that humans constantly underestimate the power of evolution to generate inconceivable traits based upon inconceivable chemistry. CRISPR genome editing (see the Doudna Key Experiment and Barrangou CRISPR Narrative), indeed, is based upon microbial machines (Cas9 enzyme) that would have been virtually impossible for scientists to engineer from scratch. Indeed, the CRISPR-Cas9 system is an interesting exception to the usual rule of evolution through spontaneous mutations and appears to be a rare example of the Lamarckian evolution, as discussed in Video 8.
Is it crazy to imagine that there are microbes that have a different DNA code or microbes that get their energy from heat rather than from light or food? What will these yet undiscovered traits tell us about life on Earth and the potential for life on other planets?
I end by hoping that Luria’s journey to discovery is now on your list of great scientific breakthroughs and that you have an appreciation for the power of quantitative analysis in the great successes of Luria or Ho. I also hope that you can appreciate how one of the life’s imperfections, the spontaneous mutation, has enabled the remarkable and ever evolving diversity of life on this planet.
Dig Deeper
Dig Deeper 1: Is a bacteriophage alive?
Would you consider a bacteriophage to be a living organism? This is one of the greatest semantic debates in biology. Are viruses living organisms? That begs the question – what are the attributes that define life? A great question for discussion in your class! Living organisms replicate. So do viruses (they are particularly good at that). However, they cannot replicate independent of a host. They get away with small genomes because they exploit the intracellular protein machinery of a living host (a prokaryote or eukaryote). Otherwise, they will sit in a sterile test tube passively for years and years. On the other hand, they possess some forms of intelligence. They can make decisions based upon their environment on when to stay dormant in a host or replicate. Many human carry dormant viruses such as herpes simplex viruses that occasionally activate to produce sores or shingles. Whether we call them living or not, there are more viruses than prokaryotes and eukaryotes on the planet so they must be doing something right!
Dig Deeper 2: Variance
Variance. To calculate variance, first determine the mean of the population. Then, subtract the mean from each number in the data set and then take that value and square it (this makes all values positive). This calculation provides a measure for how much each number in the data set differs from the mean. The variance is the average of all of those squared differences, providing a measure of the average difference of all the numbers in the data set from the mean.
Dig Deeper 3: Cell number and cell divisions
Why the final number of cells in a culture is a very good approximation of the number of cell divisions? 87% of cell divisions during the growth of a culture are contributed by the last three generations prior to sampling. Working backwards through generations, to generate 64 cells from 1, requires 32, 16, 8, 4,2, and 1 cell divisions or 63 in total. So the number of cell divisions in the last three generations is 56 compared to the number contributed by the early generations (3) which is negligible. Hence, no need to take into account the inoculum size if it is small relative to the final.
Dig Deeper 4: Viral Clearance
Why the slope of a semi-log plot of virus concentration (y axis) versus time (x axis) equals the rate constant for viral clearance? The clearance of virus over time occurs by a function called an exponential decay. It is another type of exponential function as we have already encountered with the Poisson distribution. The equation describes many other behaviors in biology, including the rate at which two molecules dissociate from one another. The equation for an exponential decay is
Nt = N0e-λt
where N is the number of viruses remaining after a certain time (t). N0 is the initial number of virus (when ABT-538 is given and the virus stops multiplying). The symbol λ is a “rate constant” – it is the parameter that determines the rate of viral clearance (or the rate at which two molecules dissociate from one another). It is usually described as a number per unit time.
If you take the natural log of both sides then
ln (Nt) = ln(N0) – λt
This results in a negative linear slope on a semi-log plot. By determining the slope of the line, one can determine the rate constant λ as was done in Figure 24.
References and Resources
Guided Paper
Luria, S. E., & Delbrück, M. (1943). Mutations of bacteria from virus sensitivity to virus resistance. Genetics, 28(6), 491–511.
Luria and Delbrück demonstrate the existence of spontaneous mutations by following the distribution of phage-resistant bacteria in cultures and show that the distribution deviates from an expected Poisson process.
DownloadHo, D.D., Neurmann, A.U., Perelson, A.S., Chen, W., Leonard, J.M., and Markowitz, M. (1995). Rapid turnover of plasma virions and CD4 lymphocytes in HIV-1 infection. Nature, 373, 123–126.
This paper shows that AIDS is primarily the result of continuous and highly productive replication of the HIV-1 virus that leads to the death of CD4 lymphocytes. The authors thus suggest that antiviral-based AIDS treatment should start as early in the infection as possible to be successful.
DownloadReferences
-
Lederberg, J. (1989). Replica plating and
indirect selection of bacterial mutants:
isolation of preadaptive mutants in bacteria by
sib selection. Genetics, 121(3), 395–399.
Historical perspective by Lederberg on the impact of the Luria Delbrück experiment, including the inspiration to use replica plating as a means to identify preexisting spontaneous mutations.
-
Lederberg, J., & Lederberg, E. M. (1952).
Replica plating and indirect selection of
bacterial mutants. Journal of Bacteriology,
63(3), 399–406
The use of replica plating by the Lederbergs to demonstrate that phage resistance occurred by spontaneous mutations
-
Robbins, R. J. (2003). Mutations of bacteria
from virus sensitivity to virus resistance,
1–37.
An excellent historical perspective of the Luria Delbrück experiment.
Resources
-
Bacterial Growth Video:
https://www.youtube.com/watch?v=gEwzDydciWc
This video depicts the rapid growth of a bacterial colony over time.
-
T-4 Bacteriophage Animation:
https://www.youtube.com/watch?v=uFXuxGuT7H8
This animation demonstrates how a T-4 bacteriophage infects a bacterium and then proliferates within. Please note that this was not the exact phage used in Luria’s experiments (T-1 phage), but they are closely related and function in a very similar manner.
-
Poisson Probability Calculator:
http://stats.areppim.com/calc/calc_poisson.php
This is an online calculator that allows you to specify the average rate of occurrences and the number of occurrences to see what the Poisson probability will be for those values.
-
Genetic Mutations and Disease Poster:
http://www.hhmi.org/biointeractive/genetic-mutations-and-disease
This poster demonstrates the differences between germline and somatic cell mutations and how those mutations can translate into human diseases.
-
Central Dogma Card Activity:
http://www.hhmi.org/biointeractive/central-dogma-card-activity
This is a hands-on students activity to aid in comprehension of eukaryotic gene expression and how this knowledge can be used to effectively treat human genetic diseases.
- The subsequent studies of bacteria and viruses led to an explosion of seminal discoveries on the structure and function of proteins and nucleic acids. For a specific example of how Luria and Delbrück’s work impacted future scientists see this iBiology talk by Bob Horvitzregarding his work on programmed cell death. The 1943 experiment of Luria and Delbrück had inspired the birth of molecular biology. It is no surprise that they won the Nobel Prize.
Activity
To learn about Poisson processes and the results of Luria’s experiment, try the interactive Poisson Simulation Activity prepared by Hernan Garcia.